. 2011 Sep 28:12:54.
doi: 10.1186/1471-2172-12-54.

Regulation of IL-2 gene expression by Siva and FOXP3 in human T cells

Affiliations

Regulation of IL-2 gene expression by Siva and FOXP3 in human T cells

Virginia K Hench et al. BMC Immunol. .

Abstract

Background: Severe autoinflammatory diseases are associated with mutations in the Foxp3 locus in both mice and humans. Foxp3 is required for the development, function, and maintenance of regulatory T cells (Tregs), a subset of CD4 cells that suppress T cell activation and inflammatory processes. Siva is a pro-apoptotic gene that is expressed across a range of tissues, including CD4 T cells. Siva interacts with three tumor necrosis factor receptor (TNFR) family members that are constitutively expressed on Treg cells: CD27, GITR, and OX40.

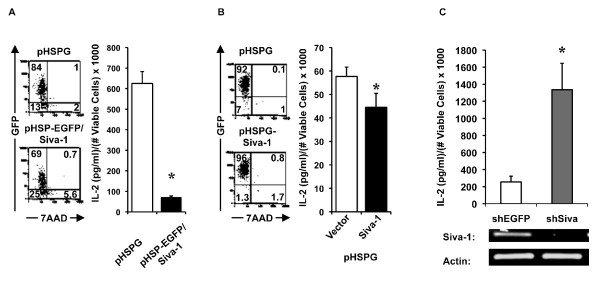
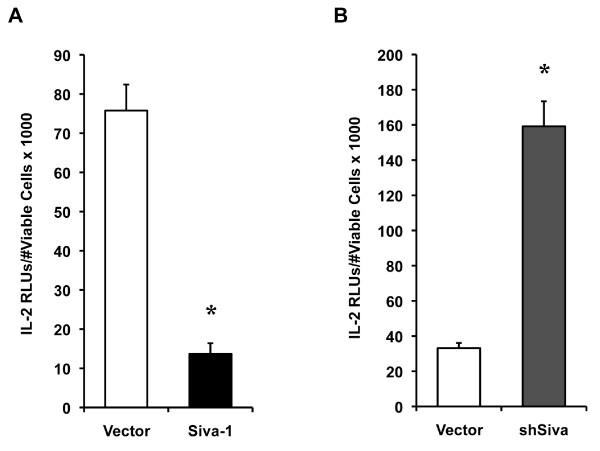
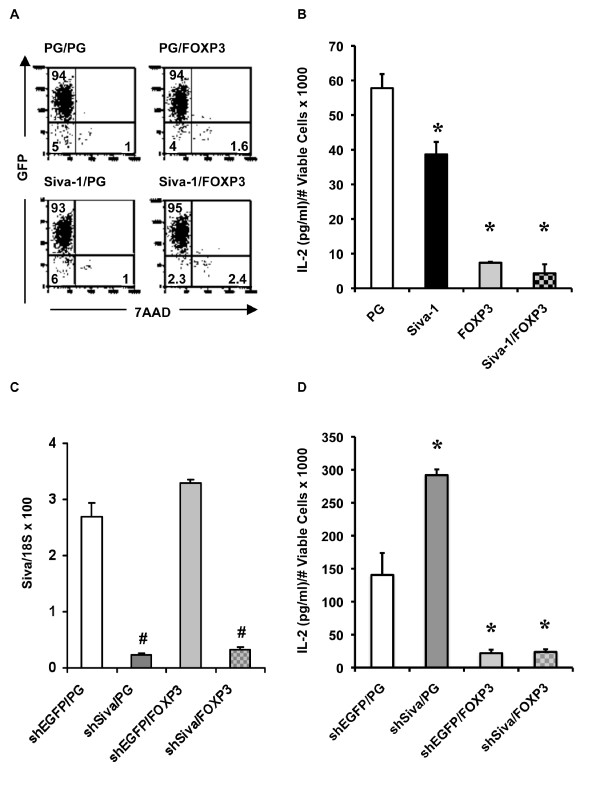
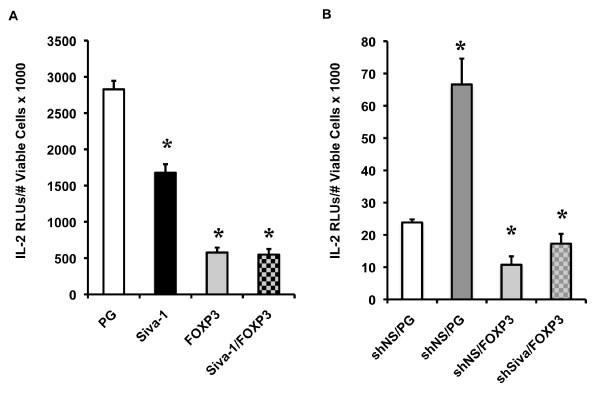
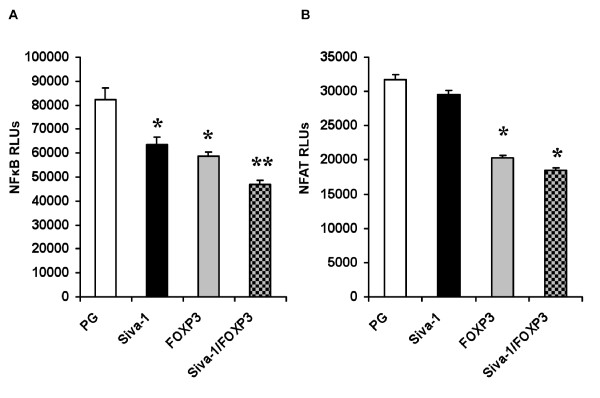
Results: Here we report a biophysical interaction between FOXP3 and Siva. We mapped the interaction domains to Siva's C-terminus and to a central region of FOXP3. We showed that Siva repressed IL-2 induction by suppressing IL-2 promoter activity during T cell activation. Siva-1's repressive effect on IL-2 gene expression appears to be mediated by inhibition of NFkappaB, whereas FOXP3 repressed both NFkappaB and NFAT activity.

Conclusions: In summary, our data suggest that both FOXP3 and Siva function as negative regulators of IL-2 gene expression in Treg cells, via suppression of NFAT by FOXP3 and of NFkappaB by both FOXP3 and Siva. Our work contributes evidence for Siva's role as a T cell signalling mediator in addition to its known pro-apoptotic function. Though further investigations are needed, evidence for the biophysical interaction between FOXP3 and Siva invites the possibility that Siva may be important for proper Treg cell function.


Figures

Figure 1
Figure 1
FOXP3 physically interacts with both Siva isoforms. A. Diagram showing the Siva protein domain organization (SAH, spherical amphipathic helix; DDHR, death domain homology region; and Zn F, zinc finger) and a cartoon representation of Siva-1 and Siva-2, which were fused to the C-terminus of EGFP. B. Co-immunoprecipitation (Co-IP) to evaluate FOXP3's interaction with Siva-1 and Siva-2 in 293T cells. Lysates from 293T cells transfected with plasmids encoding EGFP/Siva fusion constructs and Myc/FOXP3 or vector were IP'ed with mouse anti-Myc 9e10 hybridoma supernatant. Western blot (WB) was performed with a mouse monoclonal antibody against GFP. Membranes were stripped and reprobed with a rabbit anti-Myc polyclonal antibody. FOXP3 binding to Siva-1 was observed in seven independent experiments; FOXP3 binding to Siva-2 was observed in three out of three experiments. C. Siva expression based on spot intensities for CD4pos T cells isolated from the Foxp3GFP reporter mouse and sorted for both Foxp3GFP and CD25 expression [33]. The data was generated on an Affymetrix Mouse Genome 430 2.0 array platform.
Figure 2
Figure 2
Siva-binding activity is contained within a central portion of the FOXP3 protein (amino acids 106-332). A. Diagram depicting FOXP3 protein domain organization and truncation mutants that were fused to the Myc C-terminus and used in the Co-IP shown in B. (bd, binding domain; Zn F, zinc finger; L Zip, leucine zipper; Fkh, forkhead). B. Co-immunoprecipitation (Co-IP) to map FOXP3's Siva-binding activity. Co-IPs were performed as described in Figure 1. Binding between the FOXP3 Fkh mutant and Siva was tested three times. The other FOXP3 mutants shown here were tested once.
Figure 3
Figure 3
The Siva C-terminus is sufficient to bind FOXP3. A. Diagram showing the Siva protein domain organization (SAH, spherical amphipathic helix; DDHR, death domain homology region; B box; and Zn F, zinc finger) and Siva truncation mutants, which were fused to the EGFP C-terminus and tested in Co-IPs shown in B and C. B. Co-IP to map Siva's FOXP3-binding activity (hc, antibody heavy chain; lc, antibody light chain). These Siva truncation mutants were tested three times for FOXP3-binding activity. C. Co-IP to test the FOXP3-binding activity of the Siva B box and ΔB box mutants. These mutants were each tested twice for FOXP3-binding activity.
Figure 4
Figure 4
Siva represses endogenous IL-2 gene expression. A. The flow plot gating scheme used in B and C is shown. An FSC high gate was drawn to include 7AADpos cells, but exclude debris events that would falsely appear as viable, 7AADneg cells in subsequent analyses. 7AADneg events included in the FSC high gate were used to calculate viable cell number. GFP is being detected in the YFP channel, which was not used in any of these experiments. In B-D, IL-2 expression levels were divided by the mean viable cell number for each indicated sample. B. Flow plots indicating viability and transduction efficiency based on GFP expression for Jurkat T cells transduced with pHSPG retrovirus (RV) or RV expressing an EGFP/Siva-1 fusion protein (pHSP-EGFP/Siva-1). Transduced Jurkat T cells were subsequently tested for IL-2 production in response to PMA and Ionomycin. C. Similarly to data shown in B, the flow plots show Jurkat T cells transduced with RV from pHSPG or pHSPG encoding untagged Siva-1. IL-2 protein expression in response to PMA and Ionomycin for the same cells is shown. D. Knockdown (KD) of endogenous Siva with shRNA enhanced endogenous IL-2 expression. Siva-1 KD efficiency was evaluated by standard RT-PCR and DNA bands are shown. In B-D, error bars represent standard deviations for n = 3; * indicates p < 0.05 for two-tailed Student's t-test between vector transduced cells and the respective EGFP/Siva-1, Siva-1 or shSIVA expressing cells. Data shown in B-D is from one experiment representative of 3-5 replicates.
Figure 5
Figure 5
Siva represses IL-2 promoter activity. To evaluate IL-2 promoter activity, Jurkat T cells were transfected with an IL-2 luciferase reporter plasmid plus other constructs to overexpress or KD Siva expression. IL-2 promoter-driven luciferase activity is expressed as a measure of relative light units (RLUs) normalized to the viable cell number. A. Siva-1 overexpression with pHSPG-Siva-1 repressed IL-2-promoter activity. B. Siva KD by shRNA had an enhancing effect on IL-2 promoter activity. *s indicate statistical difference compared to vector based on p < 0.05 by a two-tailed Student's t-test. These experiments were each performed twice and a result from one representative experiment is shown.
Figure 6
Figure 6
Endogenous IL-2 in response to exogenous FOXP3 combined with Siva-1 overexpression or Siva knockdown. Jurkat T cells were transduced with two rounds of RV or LV and then activated with PMA and Ionomycin. Following stimulation, cell viability was determined using the gating method shown in Figure 4A and endogenous IL-2 expression was measured by ELISA. A. Flow cytometry for GFP expression and viability in unstimulated Jurkat T cells transduced with different combinations of pHSPG (PG), PG-Siva-1, and PG-FOXP3 RV. Plots shown have already been gated to exclude debris events using a gating scheme similar to the one shown in 4A. B. Endogenous IL-2 in response to FOXP3 and Siva-1 overexpression was determined using the cells shown in A. The IL-2 concentration was divided by the mean viable cell count for each indicated sample. C. Siva KD efficiency was determined by quantitative realtime PCR for Siva and 18S in unstimulated Jurkat T cells transduced with PG or PG-FOXP3 RV and pLKO-shEGFP or pLKO-shSIVA LV. The realtime PCR primers used in this experiment do not distinguish between the two Siva isoforms. The error bars indicate standard deviation between technical replicates. #s indicate statistically significant difference between the indicated bar and the adjacent, shEGFP-transduced control. D. Endogenous IL-2 in response to FOXP3 overexpression and Siva KD, using the transduced Jurkat T cells described in C. *s indicate statistically significant difference between the indicated bar and the PG- or shEGFP/PG-transduced control, in B and D, respectively. Statistically significant difference was based on p < 0.05 by a two-tailed Student's t-test. These transduction experiments were performed twice and representative experiments are shown.
Figure 7
Figure 7
IL-2 promoter activity in response to FOXP3 combined with Siva-1 overexpression or Siva knockdown. Similar to the data sets shown above, the IL-2 promoter activity was normalized to viable cell counts. A. IL-2 promoter activity in response to FOXP3 and Siva-1 overexpression. In addition to the IL-2 luciferase reporter plasmid, Jurkat T cells were transfected with different combinations of pHSPG (PG), PG-FOXP3, and PG-Siva-1. B. IL-2 promoter activity in response to FOXP3 overexpression and Siva knockdown. Jurkat T cells were transfected with the IL-2 luciferase reporter, a plasmid containing either a negative control hairpin sequence (shNS) or shSiva, and PG or PG-FOXP3 plasmids (RLUs, relative light units). *s indicate statistically significant difference between the designated bar and cells transfected with either PG in A or shNS and PG in B. Statistically significant difference was based on p < 0.05 by a two-tailed Student's t-test. These experiments were repeated twice and data from one representative experiment is shown.
Figure 8
Figure 8
NFκB and NFAT reporter activity in response to Siva-1 and FOXP3 overexpression. Jurkat T cells were transfected with NFκB and NFAT luciferase reporter plasmids and expression plasmids encoding FOXP3 or Siva-1 or the parental vector control, pHSPG (PG) (RLUs, relative light units). A. Both FOXP3 and Siva-1 repress NFκB activity in response to PMA and Ionomycin. B. FOXP3 repressed NFAT activity in response to PMA and Ionomycin. *s indicate statistically significant difference between the indicated bar and the PG vector control based on p < 0.05 by a two-tailed Student's t-test. ** indicates statistically significant difference between Siva-1 and FOXP3 in combination compared to FOXP3 alone. These experiments were repeated twice and data from one representative experiment is shown.

Similar articles

Cited by

References

    1. Feuerer M, Hill JA, Mathis D, Benoist C. Foxp3+ regulatory T cells: differentiation, specification, subphenotypes. Nat Immunol. 2009;10(7):689–695. doi: 10.1038/ni.1760. - DOI - PubMed
    1. Ziegler SF. FOXP3: of mice and men. Annu Rev Immunol. 2006;24:209–226. doi: 10.1146/annurev.immunol.24.021605.090547. - DOI - PubMed
    1. Wildin RS, Ramsdell F, Peake J, Faravelli F, Casanova JL, Buist N, Levy-Lahad E, Mazzella M, Goulet O, Perroni L. et al.X-linked neonatal diabetes mellitus, enteropathy and endocrinopathy syndrome is the human equivalent of mouse scurfy. Nat Genet. 2001;27(1):18–20. doi: 10.1038/83707. - DOI - PubMed
    1. Bennett CL, Christie J, Ramsdell F, Brunkow ME, Ferguson PJ, Whitesell L, Kelly TE, Saulsbury FT, Chance PF, Ochs HD. The immune dysregulation, polyendocrinopathy, enteropathy, X-linked syndrome (IPEX) is caused by mutations of FOXP3. Nat Genet. 2001;27(1):20–21. doi: 10.1038/83713. - DOI - PubMed
    1. Kobayashi I, Shiari R, Yamada M, Kawamura N, Okano M, Yara A, Iguchi A, Ishikawa N, Ariga T, Sakiyama Y. et al.Novel mutations of FOXP3 in two Japanese patients with immune dysregulation, polyendocrinopathy, enteropathy, X linked syndrome (IPEX) J Med Genet. 2001;38(12):874–876. doi: 10.1136/jmg.38.12.874. - DOI - PMC - PubMed

Publication types

MeSH terms