

Developmental lead exposure causes startle response deficits in zebrafish
- PMID: 21955963
- PMCID: PMC3207002
- DOI: 10.1016/j.aquatox.2011.08.014
Developmental lead exposure causes startle response deficits in zebrafish
Abstract
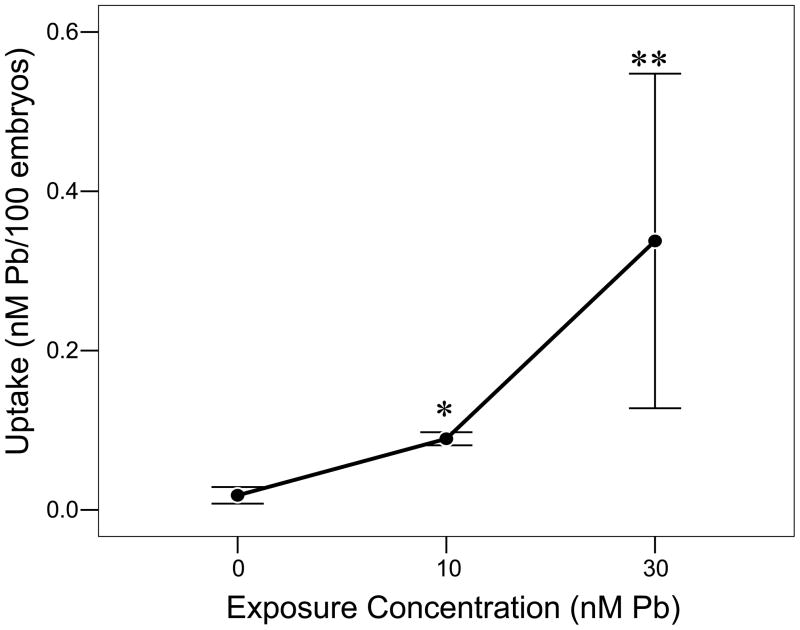
Lead (Pb(2+)) exposure continues to be an important concern for fish populations. Research is required to assess the long-term behavioral effects of low-level concentrations of Pb(2+) and the physiological mechanisms that control those behaviors. Newly fertilized zebrafish embryos (<2h post fertilization; hpf) were exposed to one of three concentrations of lead (as PbCl(2)): 0, 10, or 30 nM until 24 hpf. (1) Response to a mechanosensory stimulus: Individual larvae (168 hpf) were tested for response to a directional, mechanical stimulus. The tap frequency was adjusted to either 1 or 4 taps/s. Startle response was recorded at 1000 fps. Larvae responded in a concentration-dependent pattern for latency to reaction, maximum turn velocity, time to reach V(max) and escape time. With increasing exposure concentrations, a larger number of larvae failed to respond to even the initial tap and, for those that did respond, ceased responding earlier than control larvae. These differences were more pronounced at a frequency of 4 taps/s. (2) Response to a visual stimulus: Fish, exposed as embryos (2-24 hpf) to Pb(2+) (0-10 μM) were tested as adults under low light conditions (≈ 60 μW/m(2)) for visual responses to a rotating black bar. Visual responses were significantly degraded at Pb(2+) concentrations of 30 nM. These data suggest that zebrafish are viable models for short- and long-term sensorimotor deficits induced by acute, low-level developmental Pb(2+) exposures.
Copyright © 2011 Elsevier B.V. All rights reserved.
Figures
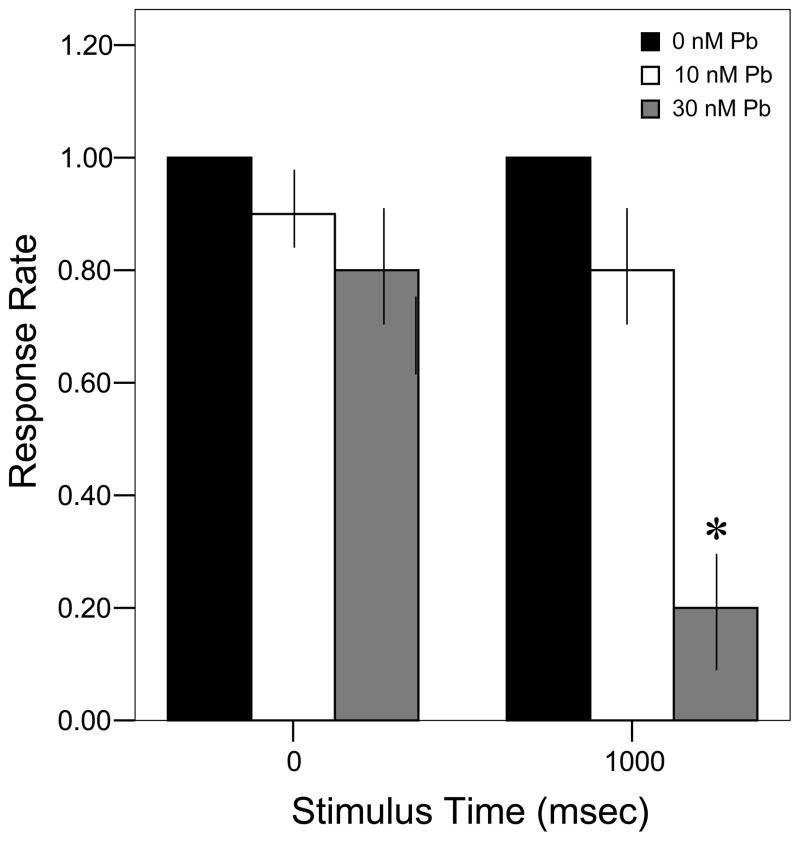
 = 30 nM Pb2+. Values = proportional number of larvae responding at each stimulus ± SD. Interval between each stimulus = 1000 msec. n = 10/exposure concentration. * = P < 0.0001 relative to control value at equivalent stimulus time.
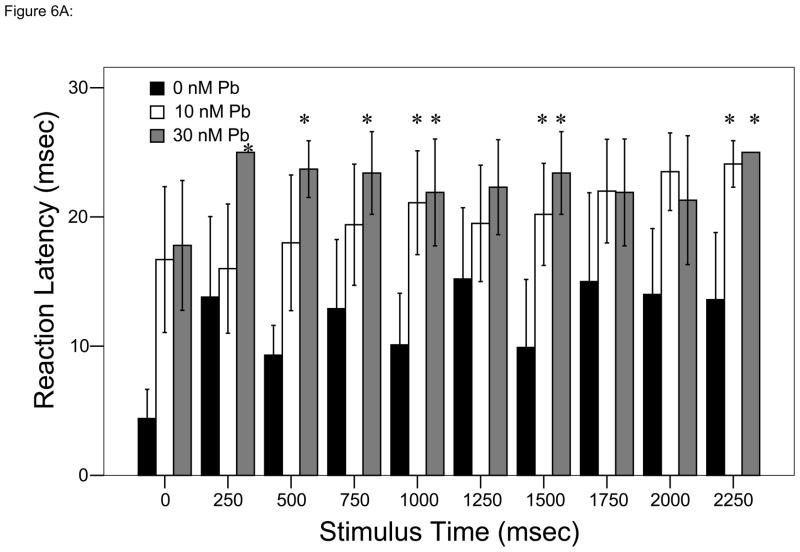
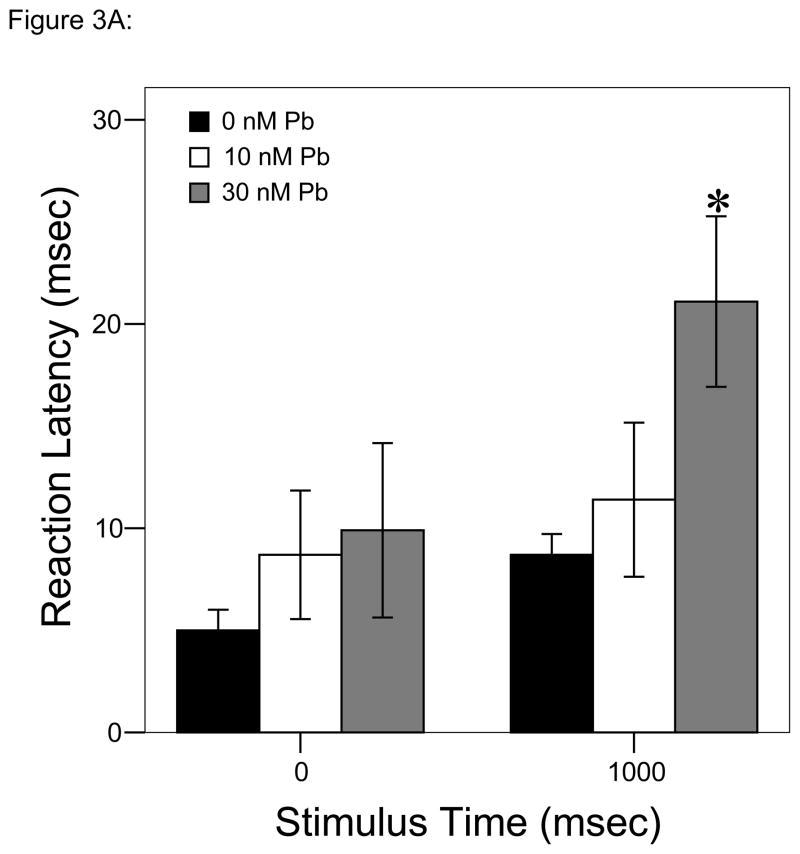 = 30 nM Pb2+. A. Time (msec) to initial response (reaction latency); B. Time (msec) to reach maximum head turning velocity (Vmax); C. Vmax (body lengths/sec); D. Duration (msec) of response (startle response + escape swim). Values = mean ± SE. Interval between each stimulus = 1000 msec. n = 10/exposure concentration. * = P < 0.05; ** = P < 0.01; *** = P < 0.001 relative to control value at equivalent stimulus time.
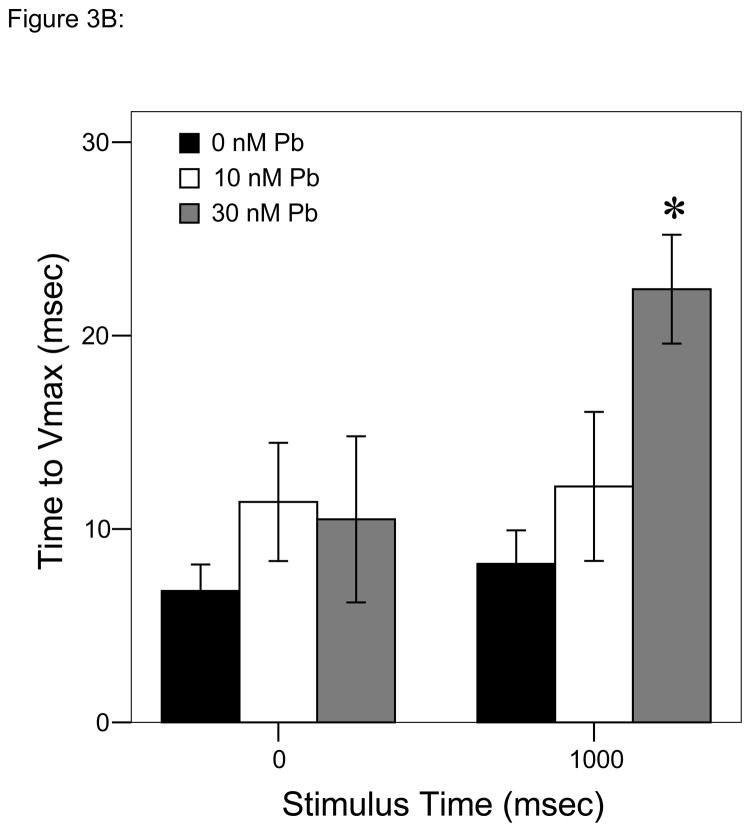 = 30 nM Pb2+. A. Time (msec) to initial response (reaction latency); B. Time (msec) to reach maximum head turning velocity (Vmax); C. Vmax (body lengths/sec); D. Duration (msec) of response (startle response + escape swim). Values = mean ± SE. Interval between each stimulus = 1000 msec. n = 10/exposure concentration. * = P < 0.05; ** = P < 0.01; *** = P < 0.001 relative to control value at equivalent stimulus time.
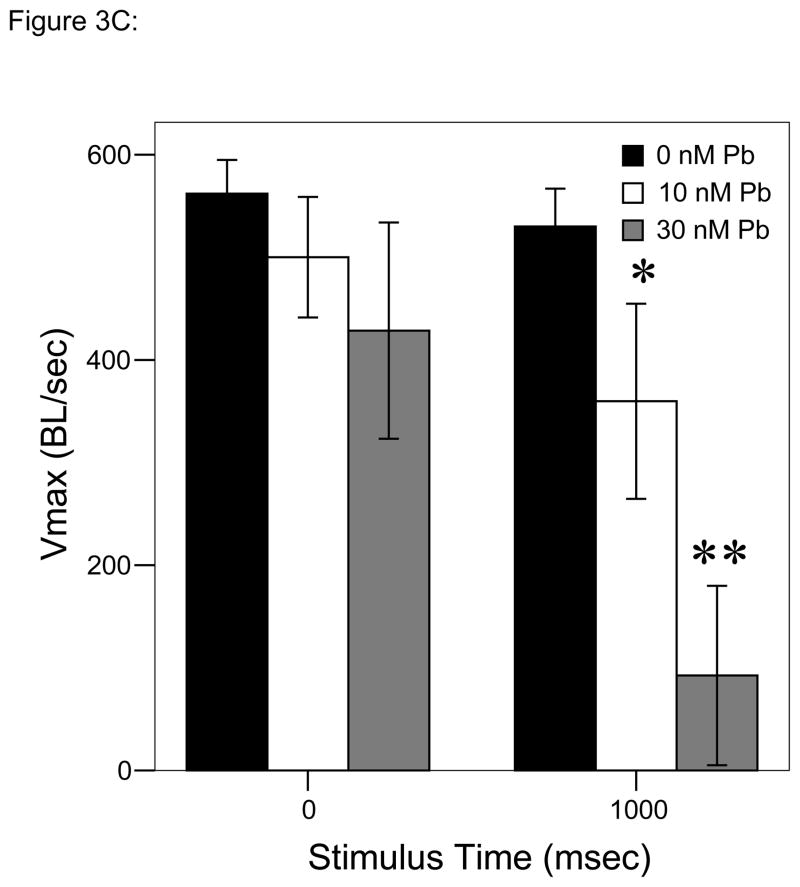 = 30 nM Pb2+. A. Time (msec) to initial response (reaction latency); B. Time (msec) to reach maximum head turning velocity (Vmax); C. Vmax (body lengths/sec); D. Duration (msec) of response (startle response + escape swim). Values = mean ± SE. Interval between each stimulus = 1000 msec. n = 10/exposure concentration. * = P < 0.05; ** = P < 0.01; *** = P < 0.001 relative to control value at equivalent stimulus time.
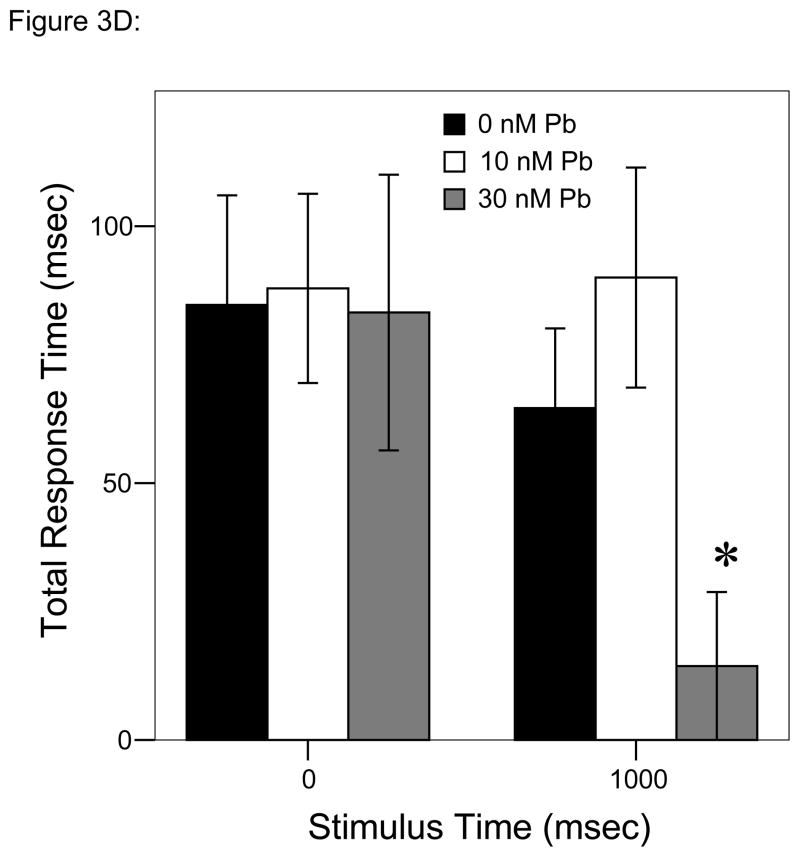 = 30 nM Pb2+. A. Time (msec) to initial response (reaction latency); B. Time (msec) to reach maximum head turning velocity (Vmax); C. Vmax (body lengths/sec); D. Duration (msec) of response (startle response + escape swim). Values = mean ± SE. Interval between each stimulus = 1000 msec. n = 10/exposure concentration. * = P < 0.05; ** = P < 0.01; *** = P < 0.001 relative to control value at equivalent stimulus time.
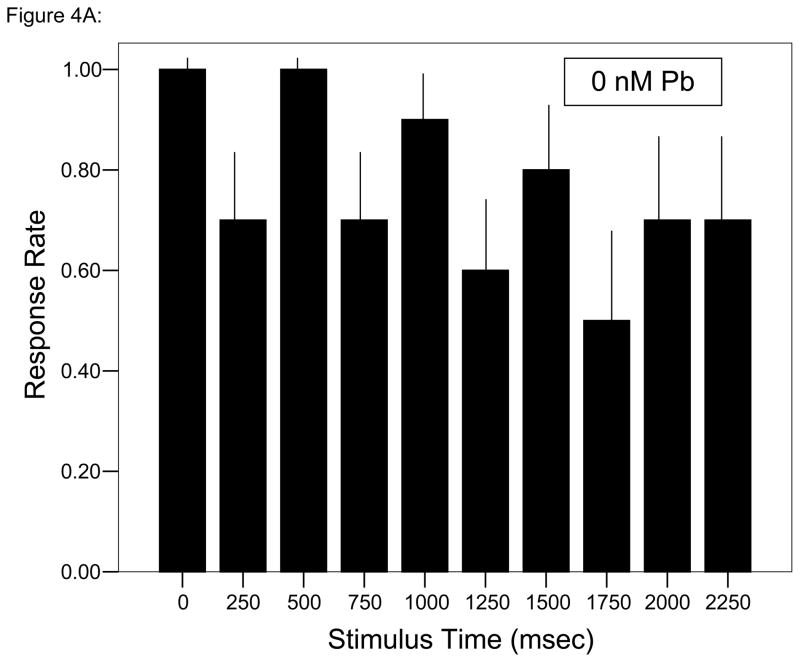 = 30 nM Pb2+. Values = proportional number of larvae responding at each tap stimulus ± SD. Interval between each stimulus = 250 msec. n = 10/exposure concentration. * = P < 0.05; ** = P < 0.01; *** = P <0.005 relative to control value at equivalent stimulus time.
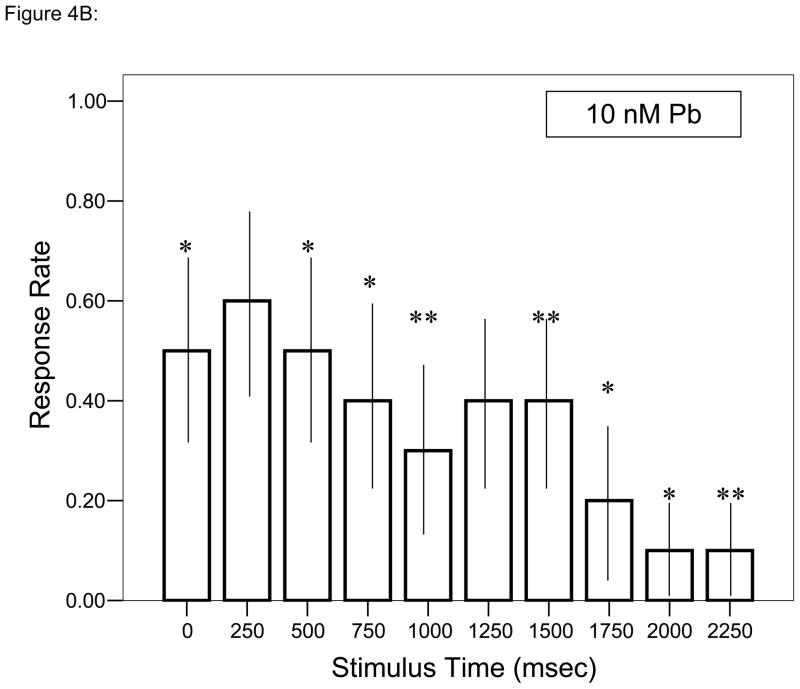 = 30 nM Pb2+. Values = proportional number of larvae responding at each tap stimulus ± SD. Interval between each stimulus = 250 msec. n = 10/exposure concentration. * = P < 0.05; ** = P < 0.01; *** = P <0.005 relative to control value at equivalent stimulus time.
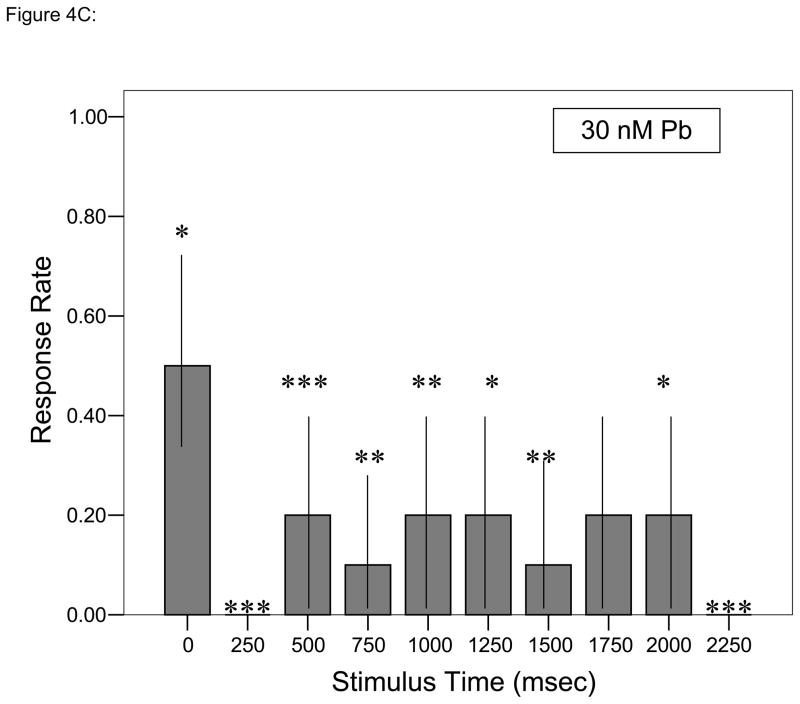 = 30 nM Pb2+. Values = proportional number of larvae responding at each tap stimulus ± SD. Interval between each stimulus = 250 msec. n = 10/exposure concentration. * = P < 0.05; ** = P < 0.01; *** = P <0.005 relative to control value at equivalent stimulus time.
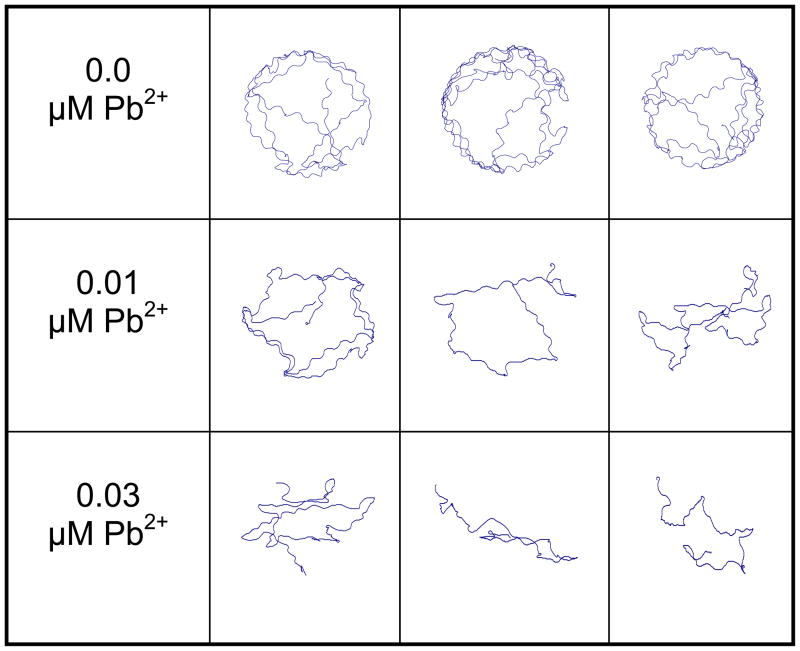
 = 30 nM Pb2+. A. Time (msec) to initial response (reaction latency); B. Time (msec) to reach maximum head turning velocity (Vmax); C. Vmax (body lengths/sec); D. Duration (msec) of response (startle response + escape swim). Values = mean ± SE. Interval between each stimulus = 250 msec. n = 10/exposure concentration. * = P < 0.05; ** = P < 0.01; *** = P <0.005 relative to control value at equivalent stimulus time.
 = 30 nM Pb2+. A. Time (msec) to initial response (reaction latency); B. Time (msec) to reach maximum head turning velocity (Vmax); C. Vmax (body lengths/sec); D. Duration (msec) of response (startle response + escape swim). Values = mean ± SE. Interval between each stimulus = 250 msec. n = 10/exposure concentration. * = P < 0.05; ** = P < 0.01; *** = P <0.005 relative to control value at equivalent stimulus time.
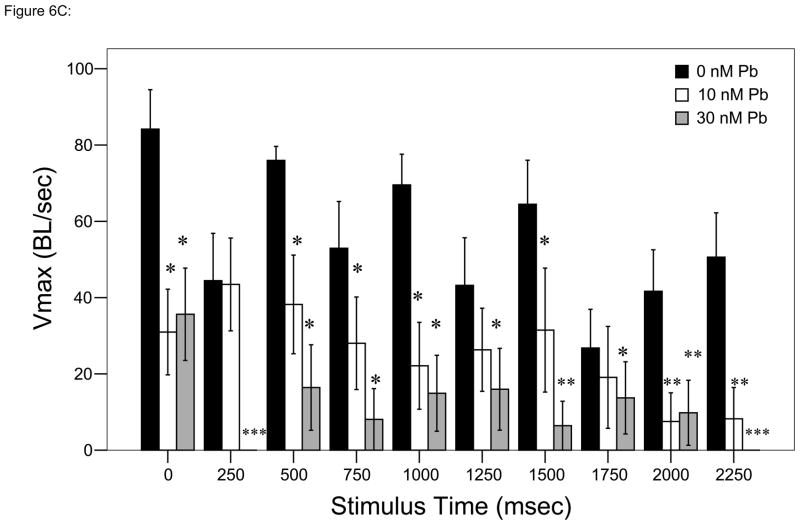 = 30 nM Pb2+. A. Time (msec) to initial response (reaction latency); B. Time (msec) to reach maximum head turning velocity (Vmax); C. Vmax (body lengths/sec); D. Duration (msec) of response (startle response + escape swim). Values = mean ± SE. Interval between each stimulus = 250 msec. n = 10/exposure concentration. * = P < 0.05; ** = P < 0.01; *** = P <0.005 relative to control value at equivalent stimulus time.
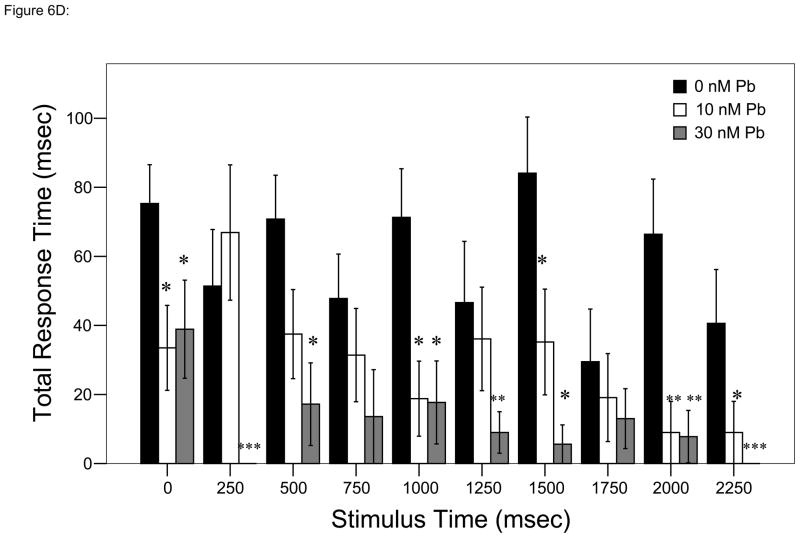 = 30 nM Pb2+. A. Time (msec) to initial response (reaction latency); B. Time (msec) to reach maximum head turning velocity (Vmax); C. Vmax (body lengths/sec); D. Duration (msec) of response (startle response + escape swim). Values = mean ± SE. Interval between each stimulus = 250 msec. n = 10/exposure concentration. * = P < 0.05; ** = P < 0.01; *** = P <0.005 relative to control value at equivalent stimulus time.
Similar articles
-
Using morphological, behavioral, and molecular biomarkers in Zebrafish to assess the toxicity of lead-contaminated sediments from a retired trapshooting range within an urban wetland.J Toxicol Environ Health A. 2018;81(18):924-938. doi: 10.1080/15287394.2018.1506958. Epub 2018 Aug 13. J Toxicol Environ Health A. 2018. PMID: 30102137
-
Environmentally relevant lead (Pb) water concentration induce toxicity in zebrafish (Danio rerio) larvae.Comp Biochem Physiol C Toxicol Pharmacol. 2022 Feb;252:109215. doi: 10.1016/j.cbpc.2021.109215. Epub 2021 Oct 18. Comp Biochem Physiol C Toxicol Pharmacol. 2022. PMID: 34673251
-
Early developmental exposure to lead (Pb) as a risk factor for stress-related disorders investigated in larval zebrafish (Danio rerio).Toxicol Sci. 2025 Jun 1;205(2):344-357. doi: 10.1093/toxsci/kfaf048. Toxicol Sci. 2025. PMID: 40193478
-
Zebrafish provide a sensitive model of persisting neurobehavioral effects of developmental chlorpyrifos exposure: comparison with nicotine and pilocarpine effects and relationship to dopamine deficits.Neurotoxicol Teratol. 2010 Jan-Feb;32(1):99-108. doi: 10.1016/j.ntt.2009.02.005. Epub 2009 Mar 4. Neurotoxicol Teratol. 2010. PMID: 19268529 Free PMC article.
-
Effects of the antidepressant, mianserin, on early development of fish embryos at low environmentally relevant concentrations.Ecotoxicol Environ Saf. 2018 Apr 15;150:144-151. doi: 10.1016/j.ecoenv.2017.12.024. Epub 2017 Dec 19. Ecotoxicol Environ Saf. 2018. PMID: 29272719
Cited by
-
Analyzing cannabinoid-induced abnormal behavior in a zebrafish model.PLoS One. 2020 Oct 8;15(10):e0236606. doi: 10.1371/journal.pone.0236606. eCollection 2020. PLoS One. 2020. PMID: 33031370 Free PMC article.
-
Novel dose-dependent alterations in excitatory GABA during embryonic development associated with lead (Pb) neurotoxicity.Toxicol Lett. 2014 Aug 17;229(1):1-8. doi: 10.1016/j.toxlet.2014.05.016. Epub 2014 May 27. Toxicol Lett. 2014. PMID: 24875535 Free PMC article.
-
Determining bad actors: A linear mixed effects model approach to elucidate behavioral toxicity of metal mixtures in drinking water.Ecotoxicol Environ Saf. 2024 Nov 15;287:117296. doi: 10.1016/j.ecoenv.2024.117296. Epub 2024 Nov 12. Ecotoxicol Environ Saf. 2024. PMID: 39536556 Free PMC article.
-
Developmental exposure to Pb2+ induces transgenerational changes to zebrafish brain transcriptome.Chemosphere. 2020 Apr;244:125527. doi: 10.1016/j.chemosphere.2019.125527. Epub 2019 Dec 2. Chemosphere. 2020. PMID: 31816550 Free PMC article.
-
Vitamin C Mitigates Oxidative Stress and Behavioral Impairments Induced by Deltamethrin and Lead Toxicity in Zebrafish.Int J Mol Sci. 2021 Nov 24;22(23):12714. doi: 10.3390/ijms222312714. Int J Mol Sci. 2021. PMID: 34884514 Free PMC article.
References
-
- Basha R, Reddy GR. Developmental exposure to lead and late life abnormalities of nervous system. Indian J Exp Biol. 2010;48:636–641. - PubMed
-
- Buekers J, Redekerm ES, Smoldersm E. Lead toxicity to wildlife: derivation of a critical blood concentration for wildlife monitoring based on literature data. Sci Total Environ. 2009;15:3431–3438. - PubMed
-
- Bunn TL, Parsons PJ, Kao E, Dietert RR. Exposure to lead during critical windows of embryonic development: differential immunotoxic outcome based on stage of exposure and gender. Toxico Sci. 2001;64:57–66. - PubMed
-
- Carvan MJ, III, Loucks E, Weber DN, Williams FE. Ethanol effects on the developing zebrafish: neurobehavior and skeletal morphogenesis. Neurotoxicol Teratol. 2004;26:757–768. - PubMed
Publication types
MeSH terms
Substances
Grants and funding
LinkOut - more resources
Full Text Sources
Miscellaneous
