. 2012 Feb;17(2):266-74.
doi: 10.1177/1087057111420292. Epub 2011 Sep 28.

Workflow and metrics for image quality control in large-scale high-content screens

Affiliations

Workflow and metrics for image quality control in large-scale high-content screens

Mark-Anthony Bray et al. J Biomol Screen. 2012 Feb.

Abstract

Automated microscopes have enabled the unprecedented collection of images at a rate that precludes visual inspection. Automated image analysis is required to identify interesting samples and extract quantitative information for high-content screening (HCS). However, researchers are impeded by the lack of metrics and software tools to identify image-based aberrations that pollute data, limiting experiment quality. The authors have developed and validated approaches to identify those image acquisition artifacts that prevent optimal extraction of knowledge from high-content microscopy experiments. They have implemented these as a versatile, open-source toolbox of algorithms and metrics readily usable by biologists to improve data quality in a wide variety of biological experiments.


Figures
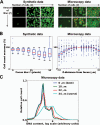
Figure 1
Figure 1
Analysis of focus metrics using synthetic and microscopy HCS image data. (A) Representative images as a function of focus blur amount F and cell count C. (B) Cell count accuracy deteriorates with increasing focal blur. (C) DNA content accuracy decreases with increasing focal blur for Hoechst microscopy images.
Figure 2
Figure 2
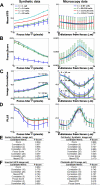
(A–D) Metric performance for synthetic nuclei and microscopy Hoechst images. For the synthetic data, plots show specific cell counts, while quartiles of the cell count distribution are plotted for the microscopy data. Image Correlation values are shown for three spatial scales as indicated, where the number specifies the spatial scale in pixels for the synthetic images and in microns for the microscopy images. Errorbars indicate standard deviation. PLLS: Power Log-Log Slope. (E, F) Table of candidate QC metrics for (E) synthetic and (F) microscopy images, rank-ordered by F-score.
Figure 3
Figure 3
(A) Examples of saturation artifacts. (B) Listing of candidate QC metrics for the microscopy Hoechst stains used, rank-ordered by F-score. STD: Standard deviation, MAD: Median absolute deviation.
Figure 4
Figure 4
Screenshots of the PlateViewer and Histogram tools in CellProfiler Analyst. (A) PlateViewer displays the plate layout for a single 384-well HCS plate; per-well averages of the Percent Maximal (PM) QC measures for the Hoechst channel are shown in color. Numerical data is shown by hovering the pointer over the well. (B) Plate layout showing image thumbnails. Clicking on a well brings up an image montage of all images available for the well, allowing visual confirmation of an artifact detected by the PM metric. (C) Histogram of PLLS from the Hoechst channel, showing gating (dotted line) and menu options. (D) Representative images from the numbered clusters in (C). Panels were cropped from the original images for visibility. (E) The list of images corresponding to the in-focus images gated in (C). (F) HCS screening example in which focus artifacts strongly affect quantitative measurement of DNA content. Two peaks are expected, as seen in the in-focus (blue) data: the left peak is 2N DNA content and the right peak is 4N DNA content. In the out-of-focus images (green), DNA content is not accurately quantified. (G) Using a well-chosen QC threshold improves the overall result. Note that the red line almost completely covers the green line, showing that the QC results are virtually indistinguishable to that of manual annotation of the in-focus images.

References

    1. Vaisberg EA, Lenzi D, Hansen RL, Keon BH, Finer JT. An infrastructure for high-throughput microscopy: instrumentation, informatics, and integration. Methods Enzymol. 2006;414:484–512. - PubMed
    1. Lehmussola A, Selinummi J, Ruusuvuori P, Niemisto A, Yli-Harja O. Simulating fluorescent microscope images of cell populations. Conf Proc IEEE Eng Med Biol Soc. 2005;3:3153–3156. - PubMed
    1. Kamentsky L, Jones TR, Fraser A, Bray MA, Logan DJ, Madden KL, Vebjorn L, Rueden C, Eliceiri KW, Carpenter AE. Improved structure, function and compatibility for CellProfiler: modular high-throughput image analysis software. Bioinformatics. 2011;27:1179–1180. - PMC - PubMed
    1. Sun Y, Duthaler S, Nelson BJ. Autofocusing in computer microscopy: selecting the optimal focus algorithm. Microsc Res Tech. 2004;65:139–149. - PubMed
    1. Fuller CJ, Straight AF. Image analysis benchmarking methods for high-content screen design. J Microsc. 2010;238:145–161. - PubMed

Publication types

LinkOut - more resources