. 2012 Jan;42(1):176-85.
doi: 10.1002/eji.201141679. Epub 2011 Dec 12.

TREM-2, triggering receptor expressed on myeloid cell-2, negatively regulates TLR responses in dendritic cells

Affiliations

TREM-2, triggering receptor expressed on myeloid cell-2, negatively regulates TLR responses in dendritic cells

Hiroaki Ito et al. Eur J Immunol. 2012 Jan.

Abstract

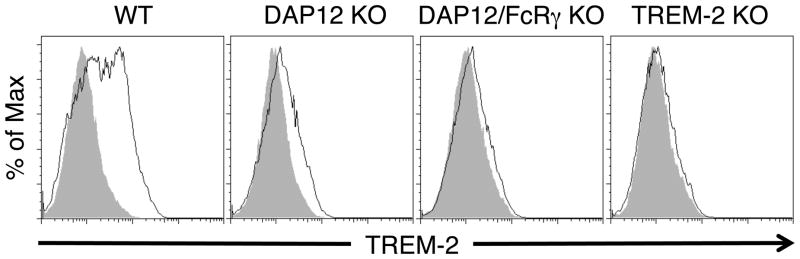
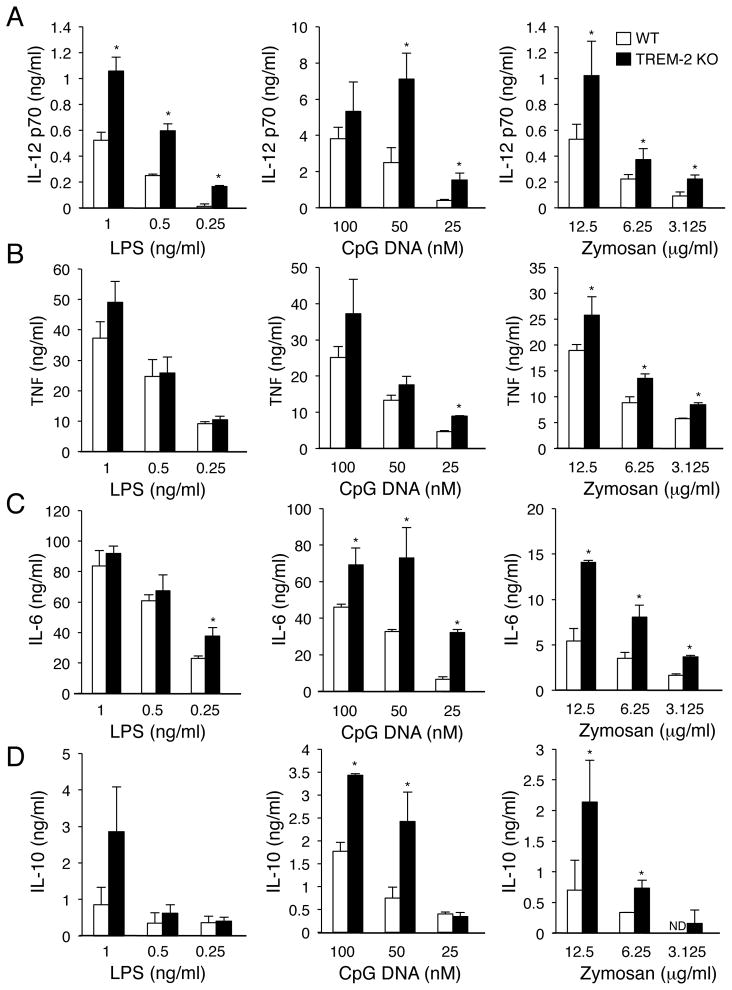
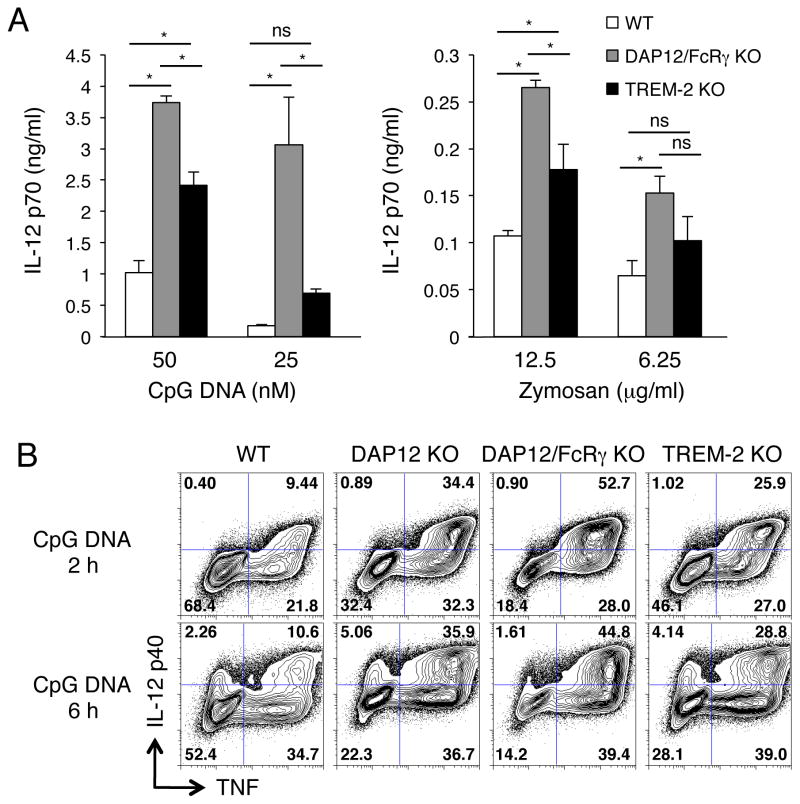
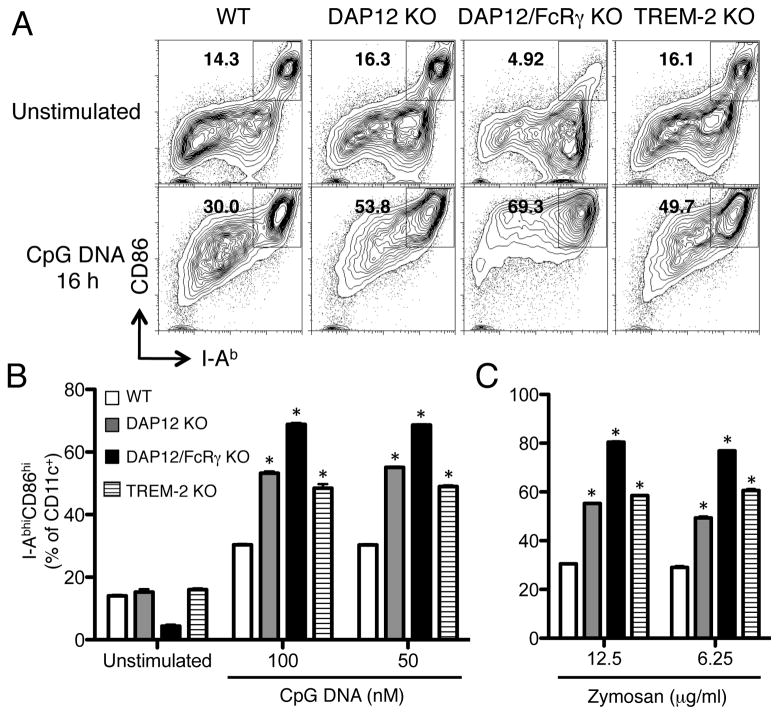
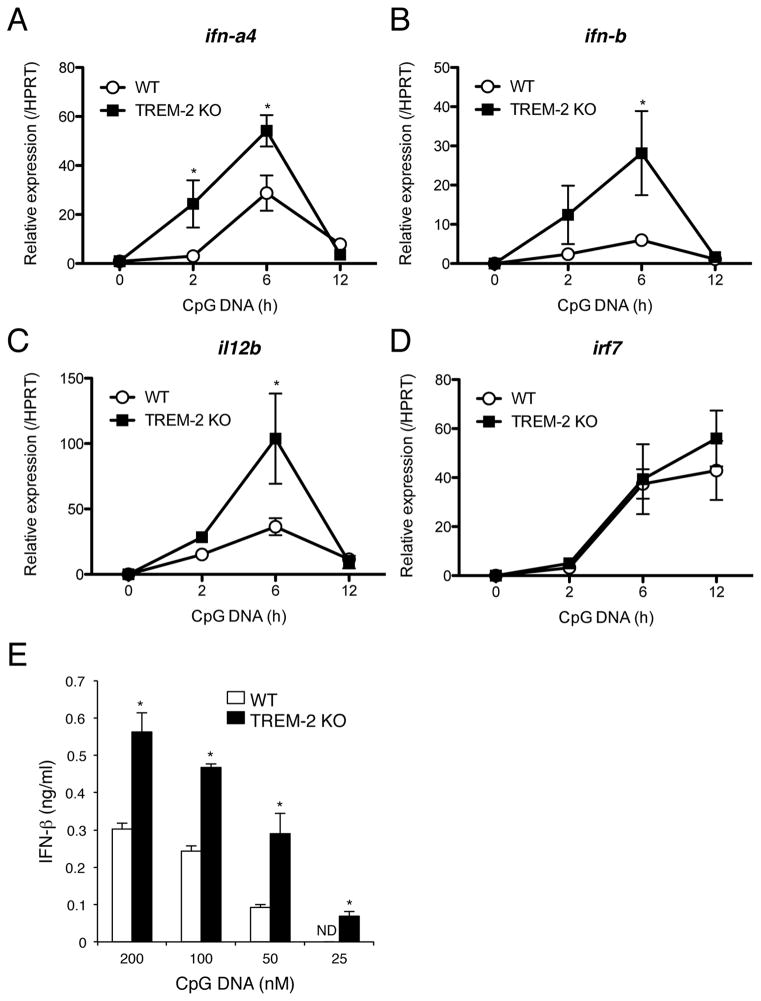
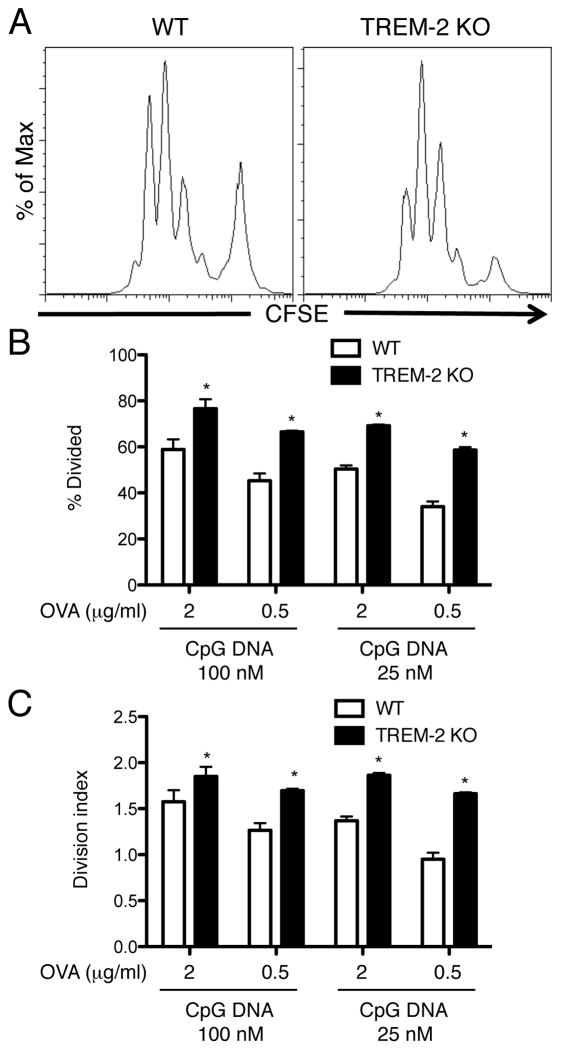
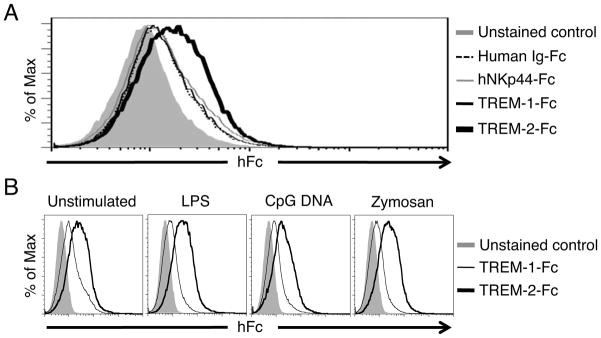
DCs play a key role in defense against infections and also in preventing inflammatory and autoimmune diseases. The response of DCs to pathogens is tightly regulated by many mechanisms to allow for appropriate, but not pathogenic, responses. We previously showed that DCs with deficiencies for two ITAM-bearing signaling adapters, DAP12 and FcRγ, produce more inflammatory cytokines upon treatment with Toll-like receptor (TLR) agonists than WT DCs. Here, we investigated whether the TREM-2 receptor pairs with DAP12 to inhibit TLR responses in DCs. TREM-2-deficient BMDCs showed increased inflammatory cytokine and type I IFN production in response to TLR ligation. Additionally, TREM-2-deficient BMDCs had increased TLR-induced maturation and were more efficient at inducing antigen-specific T-cell proliferation upon CpG DNA stimulation compared with WT BMDCs. Finally, we showed that a TREM-2 ligand is expressed on the surface of BMDCs, suggesting that the TREM-2 receptor transduces inhibitory signals due to recognition of an endogenous ligand.


Conflict of interest statement

Conflict of interest

The authors declare no financial or commercial conflict of interest.

Figures

Figure 1
Figure 1. TREM-2 is expressed on the cell surface of BMDCs in a DAP12-dependent manner
BMDCs were cultured from WT, DAP12-deficient and DAP12/FcRγ-deficient BM cells for 6 days with GM-CSF, and then stained for CD11c and TREM-2. The histograms are gated on CD11c-positive cells. The gray shaded histogram is the isotype control and the thin black line is the staining for TREM-2. These data are representative of at least three independent experiments.
Figure 2
Figure 2. Increased TLR-induced cytokine secretion from TREM-2-deficient DCs
(A–D) CD11c+ BMDCs were stimulated with the indicated doses of TLR agonists (LPS, CpG DNA and Zymosan) for 16 h. (A) IL-12 p70, (B) TNF, (C) IL-6 and (D) IL-10 concentrations in the culture supernatant were determined by ELISA. Data are represented as mean + SD of triplicate wells (* p<0.05, as determined by an unpaired two-tailed students t-test). These data are representative of two (LPS) and four (CpG DNA and Zymosan) independent experiments for TNF and IL-12 p70 and two independent experiments for IL-6 and IL-10.
Figure 3
Figure 3. TREM-2-deficient DCs produce increased TLR-induced cytokines, similar to DAP12-deficient DCs
(A) CD11c-purified BMDCs were stimulated with the indicated concentration of CpG DNA and Zymosan for 16 h and IL-12 p70 production was determined by ELISA. Data are represented as mean + SD of triplicate wells (* p<0.05, as determined by a one-way ANOVA with Bonferroni’s post-test). (B) BMDCs were incubated with CpG DNA (100 nM) for 2 h and 6 h, and then fixed, permeabilized, stained with anti-IL-12 p40 and anti-TNF Abs, and analyzed by flow cytometry. These data are representative of (A) four and (B) two independent experiments.
Figure 4
Figure 4. TREM-2-deficient DCs show increased maturation in response to TLR agonists
BMDCs were incubated with CpG DNA (100 nM) or Zymosan (12.5 μg/ml) for 16 h. After incubation, cells were stained with anti-CD11c, anti-CD86 and anti-I-Ab Abs and analyzed by flow cytometry. (A) Plots represent CD11c-positive gated cells. (B, C) The percent of CD86high/I-Abhigh CD11c+ BMDC after 16 h of (B) CpG DNA or (C) Zymosan treatment. Data are represented as mean + SD of triplicate wells. *p<0.05 versus WT, as determined by a one-way ANOVA with Dunnett’s post-test. These data are representative of at least two independent experiments.
Figure 5
Figure 5. Enhanced type I IFN responses in TREM-2-deficient DCs
(A–D) CD11c-purified BMDCs from WT and TREM-2-deficient mice were stimulated with CpG DNA (100 nM) for the indicated time and qPCR performed using specific primers against (A) IFN-α4, (B) IFN-β, (C) IL-12 p40 and (D) IRF7. HPRT was used as internal control. (E) IFN-β production from BMDCs upon CpG DNA stimulation. After 16 h of CpG stimulation, culture supernatants were recovered and IFN-β production measured by ELISA. Data are represented as mean +/− SD of triplicate wells. *p<0.03 versus WT, as determined by an unpaired two-tailed students t-test. These data are representative of two independent experiments.
Figure 6
Figure 6. Enhanced antigen-presentation activity in TREM-2-deficient DCs
(A) CD11c-purified BMDCs from WT and TREM-2-deficient mice were co-cultured with CFSE-labeled CD4+ OT-II T cells in the presence of OVA, CpG DNA and GM-CSF for 72 h. After co-culture, CFSE dilution of CD4+ OT-II T cells was detected by flow cytometry. (B) The percentage of divided and (C) division index of CD4+ T cells were calculated by Flowjo software. Data are represented as mean +/− SD of triplicate wells. *p<0.05 versus WT, as determined by an unpaired two-tailed students t-test. These data are representative of two independent experiments.
Figure 7
Figure 7. TREM-2 ligand is expressed on the cell surface of BMDCs
(A) Unstimulated BMDCs were incubated with human Ig-Fc, TREM-1-Fc, NKp44-Fc or TREM-2-Fc protein and then stained with anti-CD11c Ab. The histogram shows CD11c-positive gated cells. The solid gray histogram is the unstained control, the dashed black line is human Ig-Fc binding, the thin gray line is NKp44-Fc binding, the thin black line is TREM-1-Fc binding and the bold black line is TREM-2-Fc binding. (B) WT BMDCs were stimulated with LPS (0.5 ng/ml), CpG DNA (100 nM) or Zymosan (12.5 μg/ml) for 16 h. These BMDCs were incubated with TREM-1-Fc or TREM-2-Fc protein and then stained with anti-CD11c Ab. The histogram shows CD11c-positive gated cells. The solid gray histogram is the unstained control, the thin line is TREM-1-Fc binding, and the bold line is TREM-2-Fc binding. These data are representative of five (unstimulated) and four (LPS, CpG DNA, Zymosan treated) independent experiments.

References

    1. Banchereau J, Steinman RM. Dendritic cells and the control of immunity. Nature. 1998;392:245–252. - PubMed
    1. Janeway CA, Medzhitov R. Innate immune recognition. Annu Rev Immunol. 2002;20:197–216. - PubMed
    1. Steinman R, Hawiger D, Liu K, Bonifaz L, Bonnyay D, Mahnke K, Iyoda T, Ravetch J, Dhodapkar M, Inaba K, Nussenzweig M. Dendritic cell function in vivo during the steady state: a role in peripheral tolerance. Ann N Y Acad Sci. 2003;987:15–25. - PubMed
    1. Takeda K, Kaisho T, Akira S. Toll-like receptors. Annu Rev Immunol. 2003;21:335–376. - PubMed
    1. Kumar H, Kawai T, Akira S. Toll-like receptors and innate immunity. Biochemical and Biophysical Research Communications. 2009;388:621–625. - PubMed

Publication types

MeSH terms

LinkOut - more resources