. 2011 Nov;21(11):1833-40.
doi: 10.1101/gr.116509.110. Epub 2011 Sep 28.

Late-replicating heterochromatin is characterized by decreased cytosine methylation in the human genome

Affiliations

Late-replicating heterochromatin is characterized by decreased cytosine methylation in the human genome

Masako Suzuki et al. Genome Res. 2011 Nov.

Abstract

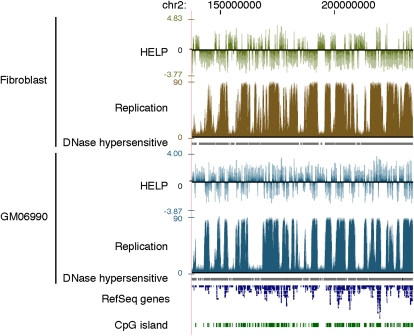
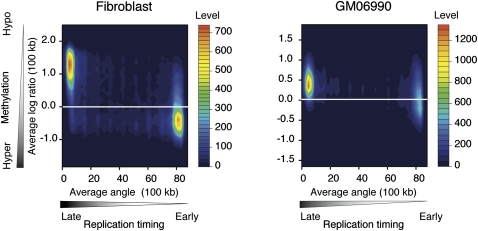
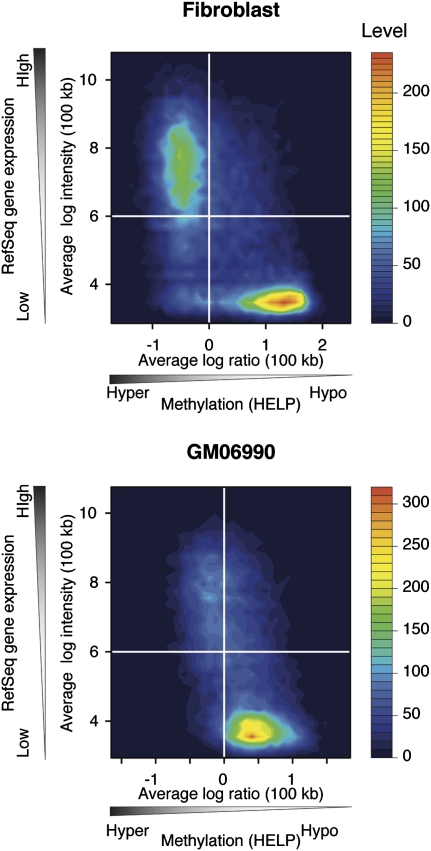
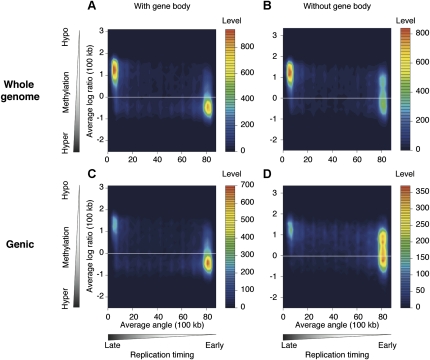
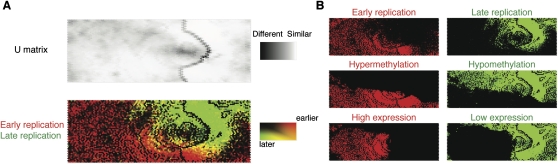
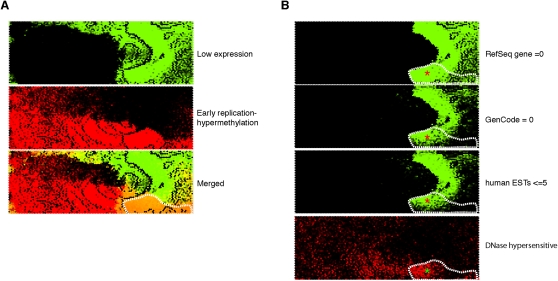
Heterochromatin is believed to be associated with increased levels of cytosine methylation. With the recent availability of genome-wide, high-resolution molecular data reflecting chromatin organization and methylation, such relationships can be explored systematically. As well-defined surrogates for heterochromatin, we tested the relationship between DNA replication timing and DNase hypersensitivity with cytosine methylation in two human cell types, unexpectedly finding the later-replicating, more heterochromatic regions to be less methylated than early replicating regions. When we integrated gene-expression data into the study, we found that regions of increased gene expression were earlier replicating, as previously identified, and that transcription-targeted cytosine methylation in gene bodies contributes to the positive correlation with early replication. A self-organizing map (SOM) approach was able to identify genomic regions with early replication and increased methylation, but lacking annotated transcripts, loci missed in simple two variable analyses, possibly encoding unrecognized intergenic transcripts. We conclude that the relationship of cytosine methylation with heterochromatin is not simple and depends on whether the genomic context is tandemly repetitive sequences often found near centromeres, which are known to be heterochromatic and methylated, or the remaining majority of the genome, where cytosine methylation is targeted preferentially to the transcriptionally active, euchromatic compartment of the genome.


Figures

Figure 1.
Figure 1.
Cytosine methylation and replication timing correlate in broad genomic regions. (Top) Fibroblast data; (bottom) GM06690 lymphoblastoid cell line data. Cytosine methylation is shown as the HpaII/MspI log2 intensity ratio from the HELP assay. Positive values indicate relative hypomethylation, and negative values indicate hypermethylation of HpaII sites. DNA replication timing data are generated from raw sequence reads by an arctangent transformation of 1-kb counts comparing early (G1 and S1) and late (S4 and G2) cell samples, as described in the Methods section. Earlier replicated regions have higher values than later replicated regions.
Figure 2.
Figure 2.
DNA hypermethylation correlates with early DNA replication timing. Filled contour plots were drawn with two-dimensional histograms. Cytosine methylation data and replication timing data are averaged in 100-kb sliding windows. The cumulative numbers of observations are shown as color-coded levels to generate the contours. Early replicated regions are more methylated in both the fibroblast and lymphoblastoid cell types.
Figure 3.
Figure 3.
Broad correlation exists between DNA hypermethylation and actively transcribed gene regions. Extending the analysis of Supplemental Figure 3 to a 100-kb sliding window representation continues to show the relationship between increased gene expression and hypermethylation of DNA. A two-dimensional histogram of the averaged HpaII/MspI log2 ratio in 100-kb windows and averaged signal intensities of the genes are represented by filled contour plots.
Figure 4.
Figure 4.
The hypermethylation of early-replicating regions is predominantly due to gene-body hypermethylation. We tested how gene-body methylation could be contributing to the patterns shown in Figure 2, reproducing the fibroblast plot to facilitate comparison in A. C shows the results when 100-kb windows that do not contain genes are removed, with a decrease in the late-replicating/hypomethylated population of signals. Excluding gene bodies, to study only intergenic methylation, generates a shift in signal distribution toward hypomethylated DNA (B), especially when the analysis is restricted to the gene-containing regions of the genome (D). These results show that a substantial proportion of the correlation of cytosine methylation with early replication is due to the methylation targeting transcribed sequences.
Figure 5.
Figure 5.
A self-organizing map analysis correlates DNA replication with methylation and transcription patterns. In this self-organizing map (SOM) representation of the multivariate data set, the top panel shows a U matrix representation of the map derived from genome-wide DNA methylation log2 ratios, RefSeq gene expression, RefSeq gene number, CpG island number, and HpaII-amplifiable fragment number in each 100-kb window. Each node is shaded using a linear grayscale that represents the mean Euclidean distance of that node vector relative to its immediate neighbors on the map ([white] most similar; [black] least similar). Overlaying loci with information about late (green) and early (red) replication shows that the parameters tested are predictive of replication timing, as evidenced by the clear separation of the red and green regions (A). We break out some of the variables used in generating the SOM (cytosine methylation, gene expression) to illustrate their overall correlations with DNA replication (B).
Figure 6.
Figure 6.
Identification of a genomic compartment where early replication and cytosine hypermethylation occur at nongenic regions. To highlight the loci where gene expression appeared to be behaving discordantly from the overall relationship with DNA replication and methylation, we represented early replicating and hypermethylated loci in red and low-expressing loci in green to illustrate these loci in the merged plot as orange (outlined in A). In B we show that a substantial proportion of these loci (area marked with red asterisks) have neither RefSeq nor Gencode genes annotated, nor even the lowest quintile of EST densities annotated for the UCSC Genome Browser. These loci are not only lacking any measurable gene expression, they do not even have any evidence for any transcriptional potential, regions usually referred to as gene deserts but with DNA-replication characteristics and DNase hypersensitivity (bottom right, green asterisk) that may indicate noncoding, nonprocessed transcription.

References

    1. Aran D, Toperoff G, Rosenberg M, Hellman A 2011. Replication timing-related and gene body-specific methylation of active human genes. Hum Mol Genet 20: 670–680 - PubMed
    1. Backdahl L, Herberth M, Wilson G, Tate P, Campos LS, Cortese R, Eckhardt F, Beck S 2009. Gene body methylation of the dimethylarginine dimethylamino-hydrolase 2 (Ddah2) gene is an epigenetic biomarker for neural stem cell differentiation. Epigenetics 4: 248–254 - PubMed
    1. Ball MP, Li JB, Gao Y, Lee JH, LeProust EM, Park IH, Xie B, Daley GQ, Church GM 2009. Targeted and genome-scale strategies reveal gene-body methylation signatures in human cells. Nat Biotechnol 27: 361–368 - PMC - PubMed
    1. Berezney R, Dubey DD, Huberman JA 2000. Heterogeneity of eukaryotic replicons, replicon clusters, and replication foci. Chromosoma 108: 471–484 - PubMed
    1. Bernardino-Sgherri J, Flagiello D, Dutrillaux B 2002. Overall DNA methylation and chromatin structure of normal and abnormal X chromosomes. Cytogenet Genome Res 99: 85–91 - PubMed

Publication types

Associated data