. 2011 Dec;52(12):2341-2351.
doi: 10.1194/jlr.D018937. Epub 2011 Sep 27.

A biochemical fluorometric method for assessing the oxidative properties of HDL

Affiliations

A biochemical fluorometric method for assessing the oxidative properties of HDL

Theodoros Kelesidis et al. J Lipid Res. 2011 Dec.

Abstract

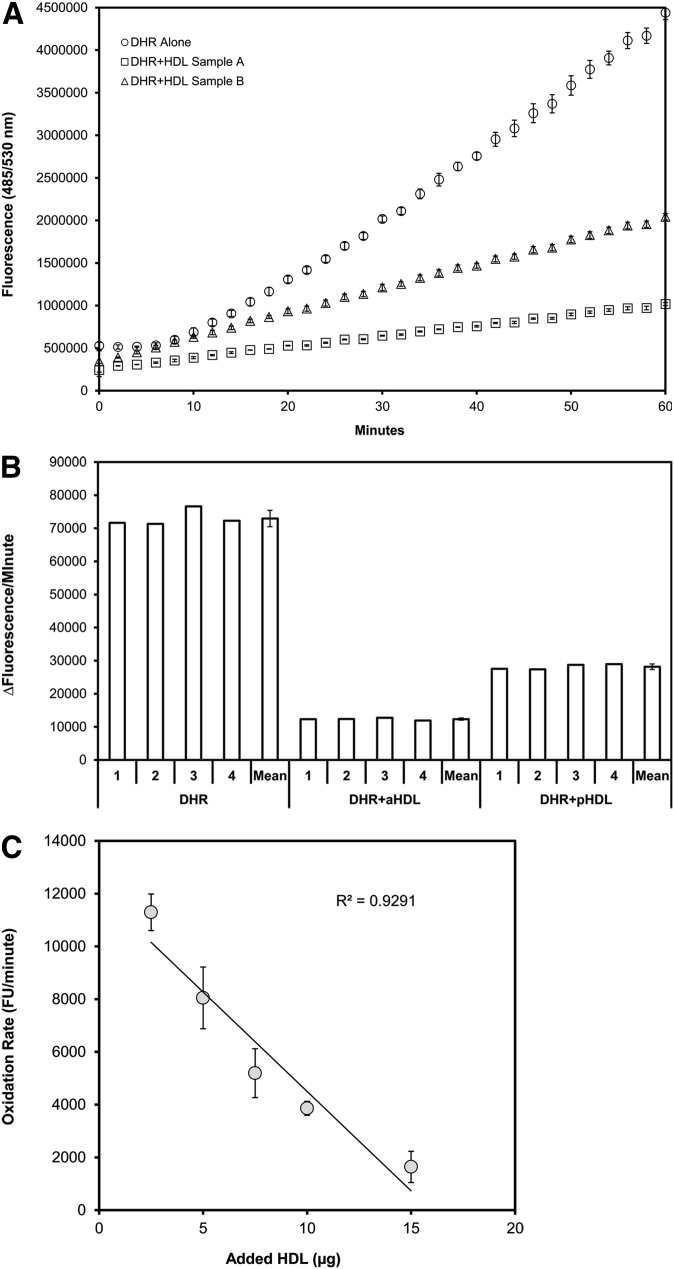
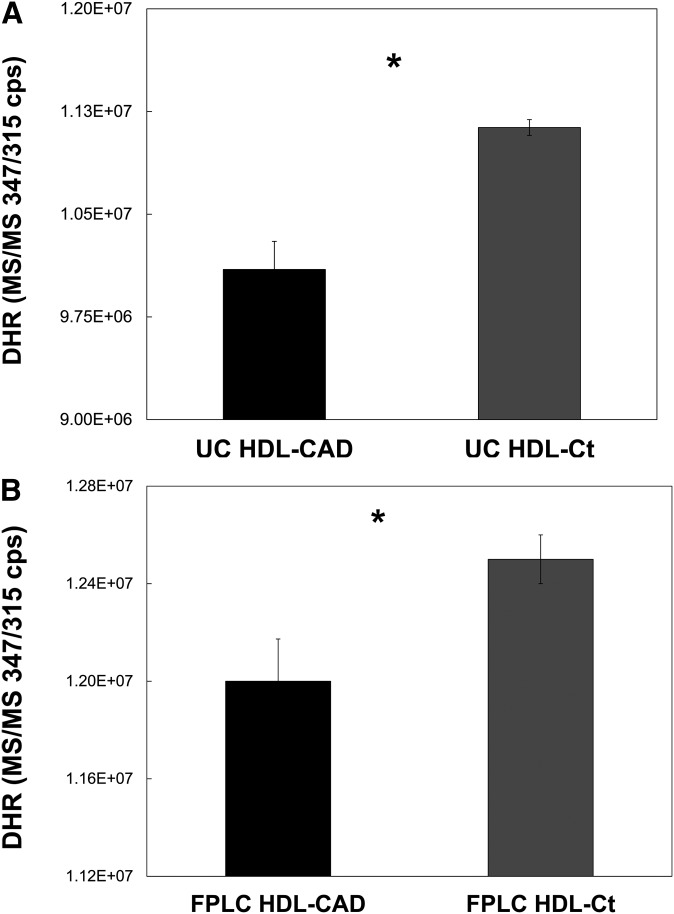
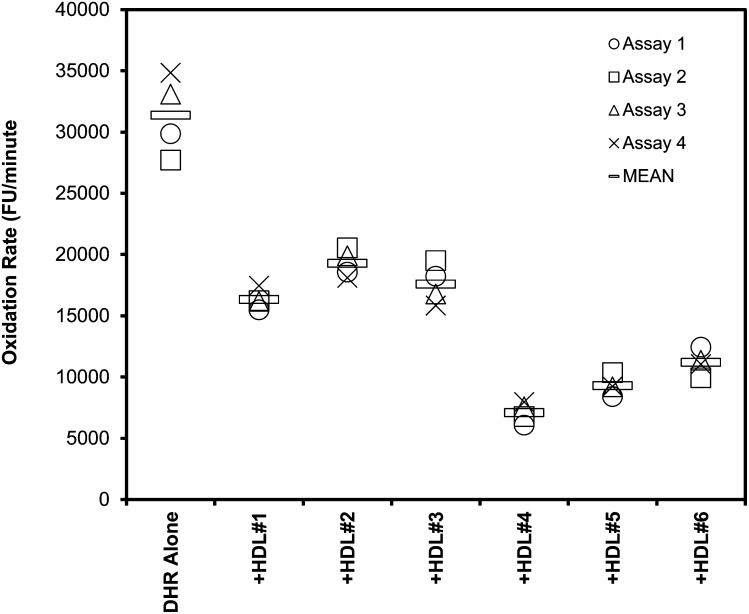
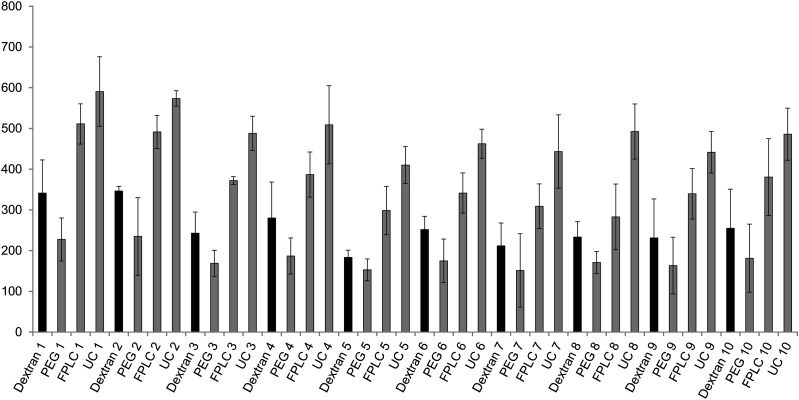
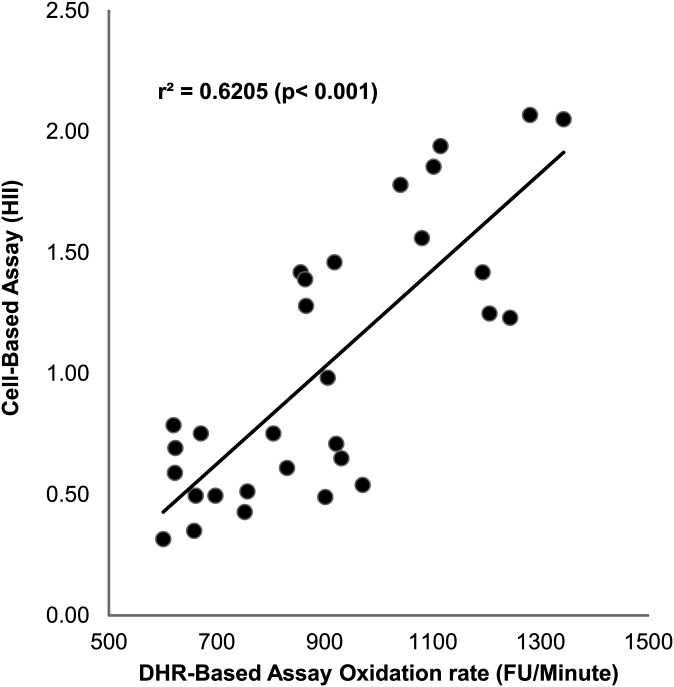
Most current assays of HDL functional properties are cell-based. We have developed a fluorometric biochemical assay based on the oxidation of dihydrorhodamine 123 (DHR) by HDL. This cell-free assay assesses the intrinsic ability of HDL to be oxidized by measuring increasing fluorescence due to DHR oxidation over time. The assay distinguishes the oxidative potential of HDL taken from different persons, and the results are reproducible. Direct comparison of this measurement correlated well with results obtained using a validated cell-based assay (r(2) = 0.62, P < 0.001). The assay can be scaled from a 96-well format to a 384-well format and, therefore, is suitable for high-throughput implementation. This new fluorometric method offers an inexpensive, accurate, and rapid means for determining the oxidative properties of HDL that is applicable to large-scale clinical studies.


Figures

Fig.1.
Fig.1.
Spontaneous oxidation of DHR and effect of added HDL. In a 96-well flat-bottom plate 50 µM DHR was added to each well alone or with 5 µg (cholesterol) of FPLC-purified HDL from a donor with anti-inflammatory HDL (aHDL) and from a donor with proinflammatory HDL (pHDL) in a total volume of 175 µl (saline with 150 mM NaCl and HEPES 20 mM, pH 7.4), each in quadruplicate. Spontaneous air-oxidation of DHR at 37°C was then followed in 2 min intervals using a fluorescence microplate reader set to detect 485/538 nm excitation/emission. A: The means and standard deviations of the quadruplicate fluorescence measurements are plotted over time. B: The rates of change in fluorescence between 20 and 50 min (calculated by linear regression) are plotted for the quadruplicates, as well as means/standard deviations. C: FPLC-purified HDL was added in varying concentrations (cholesterol) to 50 µM DHR in 175 µl in a 96-well flat-bottom plate, and the rate of change in fluorescence was measured. The rates of change in fluorescence (means and standard deviations) are plotted against the amounts of added HDL. DHR with no added HDL demonstrated a rate of 25,342 ± 2,619 fluorescence units/minute (not plotted).
Fig.2.
Fig.2.
HDL from healthy donors significantly inhibits the oxidation of DHR compared with HDL from CAD patients, as determined by LC/MS/MS. HDL was isolated from the serum of healthy and CAD-patient donors by either sequential UC or FPLC. Control (non-CAD) and CAD HDL pairs (HDL-CAD and HDL-Ct), one for each method of isolation, were combined in triplicate with DHR and incubated in the dark for 2 h. Each sample contained 2.5 µg HDL and 50 µM DHR in 175 total µl HEPES-buffered saline. After the incubation, urate was added (0.025 mM final concentration) to slow the further oxidation of DHR. The amount of DHR remaining in each sample was then determined by LC/MS/MS. For both the HDL-CAD and HDL-Ct pair isolated by UC (A) and the pair isolated by FPLC (B), the samples of the HDL-Ct contained significantly more DHR than the samples of the HDL-CAD (*P = 0.001, n = 3).
Fig.3.
Fig.3.
Low inter-assay variability between measurements of HDL effects. Oxidation of DHR in the presence of six different samples of HDL was assessed as described in Fig. 1, using 2.5 µg (cholesterol) of added HDL. The data (means of quadruplicates) from four independent experiments are plotted. The mean inter-assay variability for these six samples was 8.6% (range 5.0-11.9%), and the mean intra-assay variability was 6.6% (range 5.8-7.6%).
Fig.4.
Fig.4.
Influence of method of HDL isolation on measurements of HDL oxidative activity. Influence of method of HDL isolation on DHR oxidation was assessed using 100 µl in a 384-well flat-bottom plate, and the rate of change in fluorescence was measured as in Fig. 1. The HDL was isolated from 10 healthy volunteers (non-CAD). An amount of 15 µM DHR was exposed to 2.5 µg (cholesterol) of FPLC-purified (FPLC), ultracentrifugation-purified HDL (UC), or HDL that was isolated using dextran sulfate or polyethylene glycol as described in “Materials and Methods.” Rates of oxidation of DHR are plotted as means of quadruplicates for each sample.
Fig.5.
Fig.5.
Correlation of DHR method with cell-based method. Thirty samples of FPLC-purified HDL were assessed for their ability to inhibit DHR oxidation as shown in Fig. 1, and their HDL inflammatory index was determined in a cell-based assay as described in “Materials and Methods.” The values from each assay are plotted against each other.
Fig.6.
Fig.6.
Oxidized HDL has inflammatory properties. The HDL inflammatory index was determined for three samples of FPLC-purified HDL from healthy volunteers in a cell-based assay as described in “Materials and Methods.” The same HDL samples were oxidized as described in “Materials and Methods” (oxHDL), and the HDL inflammatory index was determined. The oxidized HDL had significantly higher HDL inflammatory index (**P = 0.002, paired t-test).
Fig.7.
Fig.7.
The DHR assay can detect established effect of statins on functional properties of HDL in animal models of atherosclerosis. A: By using FPLC, HDL was isolated from three pooled plasma samples from LDLR−/− mice on Western diet (LDLR−/− WD) for two weeks and from three pooled plasma samples from LDLR−/− mice on Western diet for two weeks that were also treated with pravastatin 12.5 μg/ml for two weeks. Each plasma sample was pooled from 4 mice (12 mice in total). Oxidation of DHR was assessed as in Fig. 1, using 2.5 µg (cholesterol) of added HDL. The oxidation slope of DHR in the presence of HDL from LDLR−/− WD + statin was normalized to the oxidation slope of DHR in the presence of HDL from LDLR−/− WD, and the percent relative differences are shown. The data represent the average of measurements from three independent experiments. There was a statistically significant reduction in the oxidation slope of DHR in the presence of HDL isolated from LDLR−/− WD + statin mice compared with the oxidation slope of DHR in the presence of HDL isolated from LDLR−/− WD mice (**P = 0.01) B: By using FPLC, HDL was isolated from three pooled plasma samples from ApoE−/− female mice on Western diet (ApoE−/− WD) for two weeks and from three pooled plasma samples from ApoE−/− female mice on Western diet for two weeks that were also treated with pravastatin 12.5 μg/ml for two weeks. Each plasma sample was pooled from 4 mice (12 mice in total). Oxidation of DHR was assessed as in Fig. 1, using 2.5 µg (cholesterol) of added HDL. The oxidation slope of DHR in the presence of HDL from ApoE−/− WD + statin was normalized to the oxidation slope of DHR in the presence of HDL from ApoE−/− WD and the percent relative differences are shown. The data represent the average of measurements from three independent experiments. There was a statistically significant reduction in the oxidation slope of DHR in the presence of HDL isolated from ApoE−/− WD + statin mice compared with the oxidation slope of DHR in the presence of HDL isolated from ApoE−/− WD mice (**P = 0.01).
Fig.8.
Fig.8.
Correlation of DHR method with previous cell-free method. Twenty samples (10 from healthy volunteers and 10 from patients with rheumatoid arthritis) of HDL isolated using precipitation with dextran sulfate were assessed for their ability to inhibit DHR oxidation as shown in Fig. 1, and their HDL inflammatory index was determined in a cell-free assay using DCFH as described in “Materials and Methods.” The values from each assay are plotted against each other.

References

    1. Navab M., Reddy S. T., Van Lenten B. J., Anantharamaiah G. M., Fogelman A. M. 2009. The role of dysfunctional HDL in atherosclerosis. J. Lipid Res. 50(Suppl): S145–S149. - PMC - PubMed
    1. Navab M., Berliner J. A., Watson A. D., Hama S. Y., Territo M. C., Lusis A. J., Shih D. M., Van Lenten B. J., Frank J. S., Demer L. L., et al. 1996. The Yin and Yang of oxidation in the development of the fatty streak. A review based on the 1994 George Lyman Duff Memorial Lecture. Arterioscler. Thromb. Vasc. Biol. 16: 831–842. - PubMed
    1. Navab M., Hama S. Y., Cooke C. J., Anantharamaiah G. M., Chaddha M., Jin L., Subbanagounder G., Faull K. F., Reddy S. T., Miller N. E., et al. 2000. Normal high density lipoprotein inhibits three steps in the formation of mildly oxidized low density lipoprotein: step 1. J. Lipid Res. 41: 1481–1494. - PubMed
    1. Navab M., Hama S. Y., Anantharamaiah G. M., Hassan K., Hough G. P., Watson A. D., Reddy S. T., Sevanian A., Fonarow G. C., Fogelman A. M. 2000. Normal high density lipoprotein inhibits three steps in the formation of mildly oxidized low density lipoprotein: steps 2 and 3. J. Lipid Res. 41: 1495–1508. - PubMed
    1. Ansell B. J., Navab M., Hama S., Kamranpour N., Fonarow G., Hough G., Rahmani S., Mottahedeh R., Dave R., Reddy S. T., et al. 2003. Inflammatory/antiinflammatory properties of high-density lipoprotein distinguish patients from control subjects better than high-density lipoprotein cholesterol levels and are favorably affected by simvastatin treatment. Circulation. 108: 2751–2756. - PubMed

Publication types

LinkOut - more resources