Comparative Study
. 2011 Sep 28;31(39):13860-9.
doi: 10.1523/JNEUROSCI.1340-11.2011.

Rapid dopamine signaling differentially modulates distinct microcircuits within the nucleus accumbens during sucrose-directed behavior

Affiliations
Comparative Study

Rapid dopamine signaling differentially modulates distinct microcircuits within the nucleus accumbens during sucrose-directed behavior

Fabio Cacciapaglia et al. J Neurosci. .

Abstract

The mesolimbic dopamine projection from the ventral tegmental area (VTA) to the nucleus accumbens (NAc) is critical in mediating reward-related behaviors, but the precise role of dopamine in this process remains unknown. We completed a series of studies to examine whether coincident changes occur in NAc cell firing and rapid dopamine release during goal-directed behaviors for sucrose and if so, to determine whether the two are causally linked. We show that distinct populations of NAc neurons differentially encode sucrose-directed behaviors, and using a combined electrophysiology/electrochemistry technique, further show that it is at those locations that rapid dopamine signaling is observed. To determine causality, NAc cell firing was recorded during selective pharmacological inactivation of dopamine burst firing using the NMDA receptor antagonist, AP-5. We show that phasic dopamine selectively modulates excitatory but not inhibitory responses of NAc neurons during sucrose-seeking behavior. Thus, rapid dopamine signaling does not exert global actions in the NAc but selectively modulates discrete NAc microcircuits that ultimately influence goal-directed actions.


Figures

Figure 1.
Figure 1.
Diagram of the behavioral task. An audiovisual cue (C) was presented on a variable interval 45 s schedule (30–60 s). Two seconds later, a lever (L) extended into the chamber. Each lever press (denoted by R at arrow) resulted in delivery of a sucrose pellet, retraction of the lever, and offset of the audiovisual cue. Missed trials (failure to lever press within 15 s of lever extension) resulted in retraction of the lever, termination of the audiovisual cue, and no sucrose delivery. Area between vertical gray lines denotes period between cue onset and lever extension.
Figure 2.
Figure 2.
Distinct populations of NAc neurons exhibit patterned discharges relative to cue onset (left) or lever press responding (right) during the task. Population PEHs show average firing rates for types CE (A), CI (B), RE (C), and RI (D) neurons. Left, Data are aligned to cue onset (C, at time 0). L, Lever extension. The average time of latency to lever press is denoted by the black triangle, and the range of times is represented by the horizontal scale bar below PEHs. Inset in A shows the average firing rate of a subset of CE neurons (n = 5) that exhibited a transient excitatory response at the lever press. Right, Data are aligned to lever press response (R, at time 0). The average time of cue onset is denoted by the black triangle, and the range of times is represented by the horizontal scale bar. Inset in C shows the average firing rate of a subset of RE neurons (n = 6) that exhibited a transient excitatory response at the lever press. Bin width was 200 ms for all PEHs here and in subsequent figures.
Figure 3.
Figure 3.
Other NAc neurons exhibit dual response profiles during the task, termed ‘multiphasic’ cells. Population PEHs show average firing rates for types CE+RI (A) and CI+RE (B) neurons. Data are aligned to cue onset (C, at time 0). L, Lever extension. The average latency to lever press is denoted by the black triangle, and the range of times is represented by the horizontal scale bar below PEHs.
Figure 4.
Figure 4.
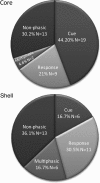
Composite pie charts showing the number and percentage of NAc neurons exhibiting different types of patterned discharges across the NAc core (top) and shell (bottom). Cue includes all type CE and type CI neurons; Response includes all type RE and type RI neurons; Multiphasic includes all type CE+RI and type CI+RE neurons. Non-phasic (type NP) includes all NAc neurons that exhibited no change in firing rate relative to cue onset or the lever press.
Figure 5.
Figure 5.
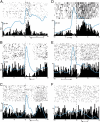
Combined electrochemical and electrophysiological recordings in the NAc during the task. Rasters and PEHs show NAc cell firing for individual neurons aligned to cue onset (left, C) or the lever press (right, R). Dopamine concentration at each location was determined by principal component analysis and is shown as a blue trace superimposed on each raster/PEH. A, Type CE neuron exhibited an increase in firing rate at cue onset coincident with a peak in dopamine concentration. B, Type CI cell showed an inhibition in activity at cue onset that coincided with a rapid raise in cue-evoked dopamine release. C, Type CI+RE neuron exhibited an inhibition at cue onset and an excitation ∼5 s later with coincident changes in rapid dopamine release. D, Type RE cell showed an excitation in activity after the lever press; the increase in dopamine concentration peaked seconds before the response and remained elevated for ∼5 s later. E, Type RI cells display an inhibition in firing at the response while dopamine peaked seconds before. F, Type NP (non-phasic) cells show no change in firing rate relative to cue onset or the lever press; no significant changes in dopamine release events are observed at this location. A–C, F, Data are aligned to cue onset (C, at time 0). L, Lever extension. The average time of latency to lever press is denoted by the black triangle, and the range of times is represented by the horizontal scale bar. D, E, Data are aligned to lever press response (R, at time 0). The average time of cue onset is denoted by the black triangle, and the range of times is represented by the horizontal scale bar.
Figure 6.
Figure 6.
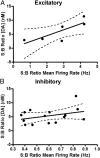
Linear regression analyses correlating S:B ratios for peak [DA] versus S:B ratios for peak changes in NAc cell firing across cell types. A, For neurons displaying increased firing rate to cue onset or the lever press (types CE, RE, and the excitatory response of CI+RE cells), a significant positive linear regression was observed. B, For neurons displaying decreased firing rate to cue onset or the lever press (types CI, RI, or the inhibitory response of CI+RE cells), the correlation was not significant.
Figure 7.
Figure 7.
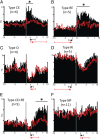
Effects of VTA inactivation on NAc neuronal activity across cell types. Population PEHs show neuronal activity after unilateral saline microinfusion into the VTA. Red lines represent activity of the same neurons following unilateral AP-5 microinfusion into the VTA. A, C, E, F, Data are aligned to cue onset (C, at time 0). L, Lever extension. The average time of latency to lever press following saline microinfusion is denoted by the black triangle, and the range of times is represented by the black horizontal scale bars. The average time of latency to lever press following AP-5 microinfusion is denoted by the red triangle, and the range of times is represented by the red horizontal scale bars. B, D, Data are aligned to lever press response (R, at time 0). The average time of cue onset is denoted by the triangles (saline, black; AP-5, red), and the range of times is represented by the horizontal scale bars (saline, black; AP-5, red). Note VTA inactivation selectively attenuated excitatory (but not inhibitory) response profiles to the cue or lever press without significantly altering baseline firing rates.
Figure 8.
Figure 8.
VTA inactivation did not affect NAc neuronal activity when injected on the contralateral (control) side for type RE (A) and type Cl (B) cells. Data are aligned to cue onset (C, at time 0). L, Lever extension.
Figure 9.
Figure 9.
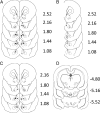
A, Coronal diagram illustrating confirmed location of microwire tip placements for experiment 1 within the NAc shell and core. B, Distribution of carbon-fiber microelectrodes in the NAc shell and core for experiment 2. C, D, Distribution of microelectrodes in the NAc shell and core (C) and guide cannulae tips in the VTA (D) for experiment 3. Numbers to the right indicate the anteroposterior coordinates (±0.2 mm) relative to bregma. Coordinates and drawings were taken from a stereotaxic atlas (Paxinos and Watson, 2005).

References

    1. Aragona BJ, Day JJ, Roitman MF, Cleaveland NA, Wightman RM, Carelli RM. Regional specificity in the real-time development of phasic dopamine transmission patterns during acquisition of a cue-cocaine association in rats. Eur J Neurosci. 2009;30:1889–1899. - PMC - PubMed
    1. Berke JD. Uncoordinated firing rate changes of striatal fast-spiking interneurons during behavioral task performance. J Neurosci. 2008;28:10075–10080. - PMC - PubMed
    1. Carelli RM. Activation of accumbens cell firing by stimuli associated with cocaine delivery during self-administration. Synapse. 2000;35:238–242. - PubMed
    1. Carelli RM. Nucleus accumbens cell firing during goal-directed behaviors for cocaine vs ‘natural’ reinforcement. Physiol Behav. 2002;76:379–387. - PubMed
    1. Carelli RM, Wightman RM. Functional microcircuitry in the accumbens underlying drug addiction: insights from real-time signaling during behavior. Curr Opin Neurobiol. 2004;14:763–768. - PubMed

Publication types

LinkOut - more resources