. 2011;6(9):e24981.
doi: 10.1371/journal.pone.0024981. Epub 2011 Sep 21.

The developmental trajectory of brain-scalp distance from birth through childhood: implications for functional neuroimaging

Affiliations

The developmental trajectory of brain-scalp distance from birth through childhood: implications for functional neuroimaging

Michael S Beauchamp et al. PLoS One. 2011.

Abstract

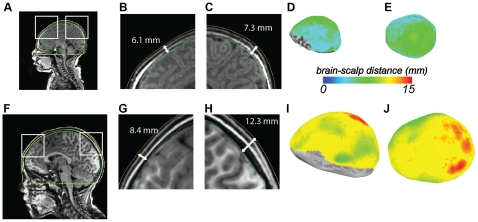
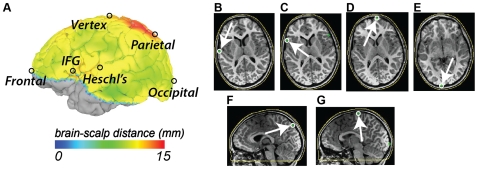
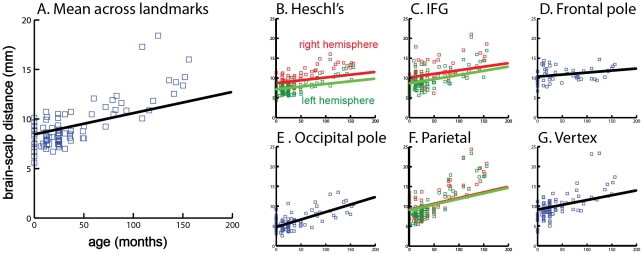
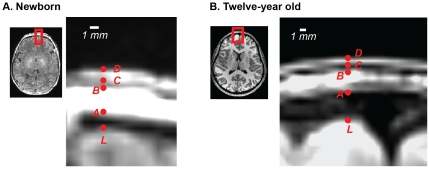
Measurements of human brain function in children are of increasing interest in cognitive neuroscience. Many techniques for brain mapping used in children, including functional near-infrared spectroscopy (fNIRS), electroencephalography (EEG), magnetoencephalography (MEG) and transcranial magnetic stimulation (TMS), use probes placed on or near the scalp. The distance between the scalp and the brain is a key variable for these techniques because optical, electrical and magnetic signals are attenuated by distance. However, little is known about how scalp-brain distance differs between different cortical regions in children or how it changes with development. We investigated scalp-brain distance in 71 children, from newborn to age 12 years, using structural T1-weighted MRI scans of the whole head. Three-dimensional reconstructions were created from the scalp surface to allow for accurate calculation of brain-scalp distance. Nine brain landmarks in different cortical regions were manually selected in each subject based on the published fNIRS literature. Significant effects were found for age, cortical region and hemisphere. Brain-scalp distances were lowest in young children, and increased with age to up to double the newborn distance. There were also dramatic differences between brain regions, with up to 50% differences between landmarks. In frontal and temporal regions, scalp-brain distances were significantly greater in the right hemisphere than in the left hemisphere. The largest contributors to developmental changes in brain-scalp distance were increases in the corticospinal fluid (CSF) and inner table of the cranium. These results have important implications for functional imaging studies of children: age and brain-region related differences in fNIRS signals could be due to the confounding factor of brain-scalp distance and not true differences in brain activity.


Conflict of interest statement

Competing Interests: The authors have declared that no competing interests exist.

Figures

Figure 1
Figure 1. Whole-brain calculation of brain-scalp distance.
A. Mid-sagittal slice through a full-term newborn brain (FT2009, age 2 days). The green line shows the reconstruction of the brain hull (bounding box of the cerebral cortex). The yellow line shows the reconstruction of the scalp surface. Both surfaces are truncated on the ventral surface of the brain (distance estimates were not computed for inferior brain regions where brain-scalp distance is ill-defined.) The white boxes show the areas enlarged in (B) and (C). B. Enlargement of anterior portion of mid-sagittal slice of newborn brain. The white line shows the distance between the reconstruction of the brain hull (green line) and the scalp surface (yellow line) at one location in medial prefrontal cortex. Note that while the brain-scalp distance is shown on a two-dimensional slice for illustration, all distances were calculated using the minimum distance in three dimensions. C. Enlargement of posterior portion of mid-sagittal slice of newborn brain. D. Lateral view of newborn brain hull surface model. Colors indicate distance between brain and scalp at each brain location (color scale shown below). Lack of color indicates regions with ill-defined brain-scalp distance in inferior regions of the brain. E. Superior view of newborn brain hull surface model. F. Mid-sagittal slice through a child brain (subject CBB, age 7 years). G. Enlargement of anterior portion of mid-sagittal slice of child brain. Same scale as (B). H. Enlargement of posterior portion of mid-sagittal slice of child brain. I. Lateral view of child brain hull surface model. The brain is shown to the same scale as the newborn brain in (D). J. Superior view of brain hull surface model. Red colors indicate greatest distance between brain and scalp.
Figure 2
Figure 2. Selection of anatomical landmarks.
A. Lateral view of pial surface of left hemisphere. Color scale indicates distance between brain and scalp. Black circles indicate location of anatomical landmarks (IFG, inferior frontal gyrus par triangularis). B. Location of Heschl's gyrus anatomical landmark shown on axial slice. Green symbol inside white circle indicates landmark. White arrow highlights location. Yellow curve shows reconstruction of scalp surface. C. Location of inferior frontal gyrus par triangularis landmark on axial slice. D. Location of frontal pole landmark on axial slice. E. Location of occipital pole landmark on axial slice. F. Location of parietal landmark (superior and posterior most portion of parieto-occipital sulcus) on sagittal slice. G. Location of vertex landmark on sagittal slice.
Figure 3
Figure 3. Growth charts for brain-scalp distance.
A. Mean growth chart averaged across all brain landmarks. Black line indicates best-fit growth function D = a * t+b where D is brain-scalp distance in mm (y – axis) and t is age in months (x – axis). Each blue square shows average brain-scalp distance in one subject. Fit parameters are a = 0.021, b = 8.5, r2 = 0.15, F1,88 = 16, p = 0.0001. B. Growth chart for Heschl's gyrus. Axis labels are the same as (A). Green squares indicate brain-scalp distance for left Heschl's gyrus in each individual subject and best-fit line; red squares indicate right Heschl's gyrus and best-fit line. Left hemisphere fit parameters are a = 0.013, b = 7.2, r2 = 0.08, F1,82 = 7, p = 0.01. Right hemisphere fit parameters are a = 0.014, b = 8.7, r2 = 0.06, F1,84 = 5, p = 0.02. C. Brain-scalp distance across age for left and right inferior frontal gyrus par triangularis. Left hemisphere fit parameters are a = 0.021, b = 8.75, r2 = 0.1, F1,87 = 10, p = 0.002. Right hemisphere fit parameters are a = 0.018, b = 10.2, r2 = 0.07, F1,77 = 6, p = 0.02. D. Growth chart for frontal pole landmark. Fit parameters are a = 0.010, b = 10.4, r2 = 0.08, F1,52 = 4, p = 0.04. E. Growth chart for occipital pole landmark. Fit parameters are a = 0.038, b = 4.7, r2 = 0.48, F1,86 = 80, p = 10−13. F. Growth chart for left and right parieto-occipital sulcus landmarks. Left hemisphere fit parameters are a = 0.028, b = 9.1, r2 = 0.09, F1,86 = 9, p = 0.004. Right hemisphere fit parameters are a = 0.029, b = 9.3, r2 = 0.09, F1,88 = 9, p = 0.004. G. Growth chart for vertex landmark. Fit parameters are a = 0.024, b = 9.1, r2 = 0.10, F1,85 = 9, p = 0.003.
Figure 4
Figure 4. Components of brain-scalp distance.
A. Enlarged axial slice through a newborn infant brain (subject FT2009, age 2 days). White shows scale bar. Red letters show manually selected landmarks. L: Frontal pole landmark (outer boundary of cerebral cortex). A: Inner boundary of cranial bone marrow. B: Outer boundary of cranial bone marrow. C: Inner boundary of cutis. D: Outer boundary of cutis. B. Enlarged axial slice through a child brain (subject CBP, age 12 years). White shows scale bar. Red letters show manually selected landmarks.

References

    1. Gratton G, Fabiani M. Fast optical imaging of human brain function. Frontiers in human neuroscience. 2010;4:52. - PMC - PubMed
    1. Boas DA, Gaudette T, Strangman G, Cheng X, Marota JJ, et al. The accuracy of near infrared spectroscopy and imaging during focal changes in cerebral hemodynamics. Neuro Image. 2001;13:76–90. - PubMed
    1. Taga G, Asakawa K, Maki A, Konishi Y, Koizumi H. Brain imaging in awake infants by near-infrared optical topography. Proceedings of the National Academy of Sciences of the United States of America. 2003;100:10722–10727. - PMC - PubMed
    1. Joseph DK, Huppert TJ, Franceschini MA, Boas DA. Diffuse optical tomography system to image brain activation with improved spatial resolution and validation with functional magnetic resonance imaging. Applied Optics. 2006;45:8142–8151. - PubMed
    1. Huppert TJ, Diamond SG, Boas DA. Direct estimation of evoked hemoglobin changes by multimodality fusion imaging. Journal of biomedical optics. 2008;13:054031. - PMC - PubMed

Publication types