. 2011 Nov 16;133(45):18272-9.
doi: 10.1021/ja206203c. Epub 2011 Oct 20.

Metabolism of selenite in human lung cancer cells: X-ray absorption and fluorescence studies

Affiliations

Metabolism of selenite in human lung cancer cells: X-ray absorption and fluorescence studies

Claire M Weekley et al. J Am Chem Soc. .

Abstract

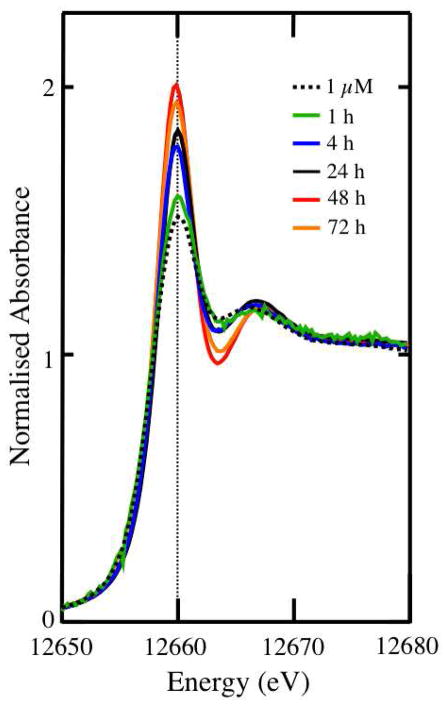
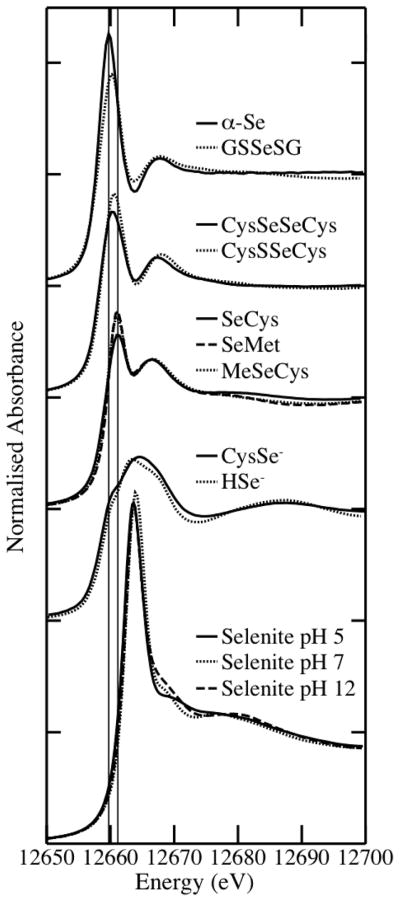
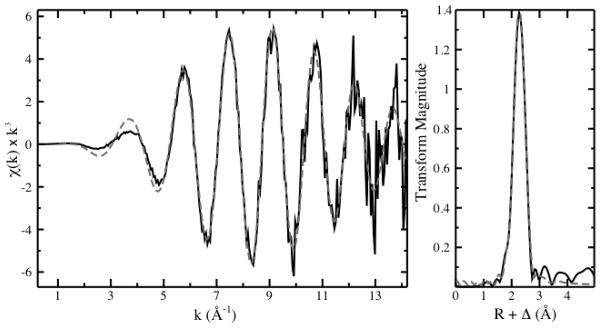
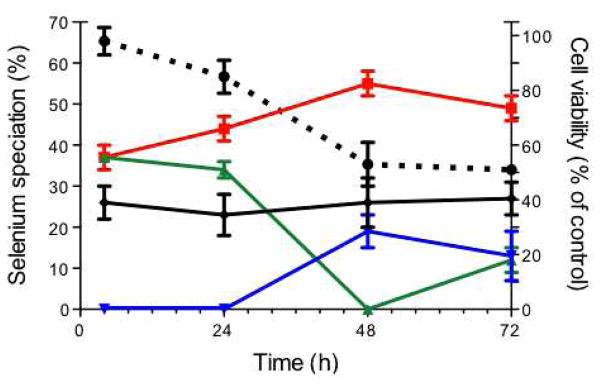
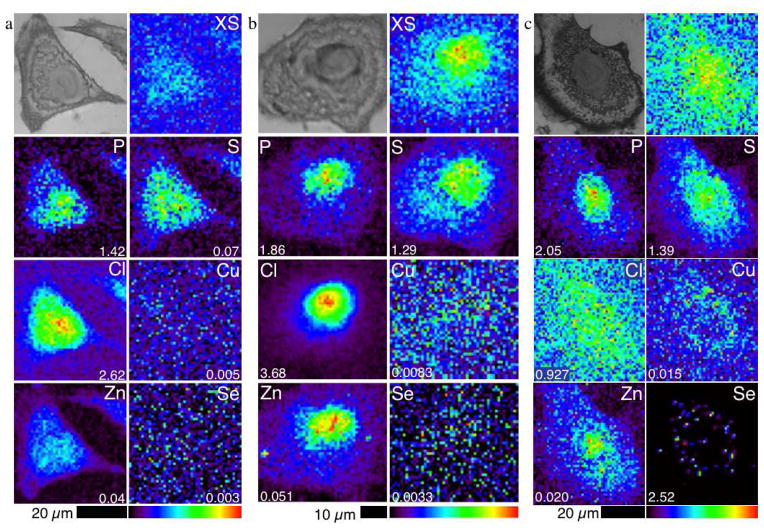
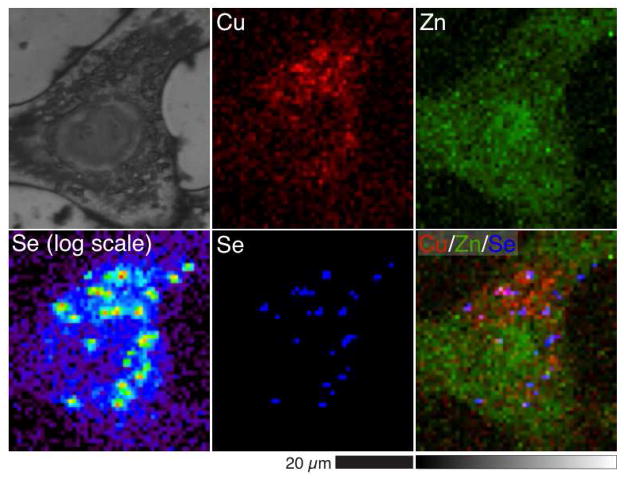
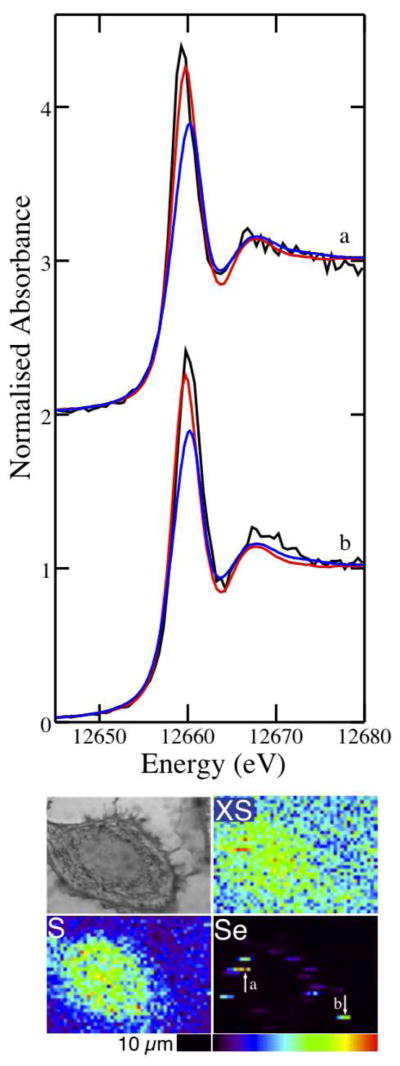
Selenite is an inorganic form of selenium that has a cytotoxic effect against several human cancer cell lines: one or more selenite metabolites are considered to be responsible for its toxicity. X-ray absorption spectroscopy was used to monitor Se speciation in A549 human lung cancer cells incubated with selenite over 72 h. As anticipated, selenodiglutathione and elemental Se both comprised a large proportion of Se in the cells between 4 and 72 h after treatment, which is in accordance with the reductive metabolism of selenite in the presence of glutathione and glutathione reductase/NADPH system. Selenocystine was also present in the cells but was only detected as a significant component between 24 and 48 h concomitant with a decrease in the proportion of selenocysteine and the viability of the cells. The change in speciation from the selenol, selenocysteine, to the diselenide, selenocystine, is indicative of a change in the redox status of the cells to a more oxidizing environment, likely brought about by metabolites of selenite. X-ray fluorescence microscopy of single cells treated with selenite for 24 h revealed a punctate distribution of Se in the cytoplasm. The accumulation of Se was associated with a greater than 2-fold increase in Cu, which was colocalized with Se. Selenium K-edge extended X-ray absorption fine structure (EXAFS) spectroscopy revealed Se-Se and Se-S bonding, but not Se-Cu bonding, despite the spatial association of Se and Cu. Microprobe X-ray absorption near-edge structure spectroscopy (μ-XANES) showed that the highly localized Se species was mostly elemental Se.


Figures

Figure 1
Figure 1
Se K-edge X-ray absorption near-edge spectra of A549 cells treated with selenite. Cells were cultured to yield a monolayer as described in the Methods section. Next, the monolayers were treated with 1 μM selenite for 24 h or 5 μM selenite for 1, 4, 24, 48 or 72 h, then worked up and X-ray absorption near-edge spectral analysis performed as described in detail in the Methods section.
Figure 2
Figure 2
Se K-edge X-ray absorption near-edge spectra of Se model compounds. α-Se, red elemental selenium; GSSeSG, selenodiglutathione; CysSeSeCys, selenocystine; CysSSeCys, sulfoselenocystine; SeCys, selenocysteine; SeMet, selenomethionine; MeSeCys, methylselenocysteine; CysSe, deprotonated selenocysteine; HSe, hydrogen selenide. Reprinted with permission from ref . Copyright 2011 American Chemical Society.
Figure 3
Figure 3
EXAFS spectrum (left) and corresponding Fourier Transform (right) of A549 cells treated with 5 μM selenite for 24 h (black solid line). The calculated fit to the spectrum is shown (grey dashed line). Fit parameters are listed in Table 2.
Figure 4
Figure 4
Cell viability and speciation of Se in cells treated with 5 μM selenite for 4 h to 72 h. Percentage cell viability (dotted black line) is shown as the mean ± standard deviation of three independent experiments, each with 8 replicates. Selenium speciation is shown as a percentage of the component fitted to the Se K-edge XANES spectrum ± estimated standard deviation as recorded in Table 1. The components are elemental Se (red), GSSeSG (solid black), SeCys (green) and CysSeSeCys (blue).
Figure 5
Figure 5
Optical micrographs (top left) and scattered X-ray (XS) and XRF elemental distribution maps of P, S, Cl, Cu, Zn, and Se of an A549 cell treated with (a) PBS as a vehicle control for 1 h, (b) 5 μM selenite for 20 min and (c) 5 μM selenite for 24 h. The maximal elemental area density (in micrograms per square centimeter) is given in the bottom corner of each map.
Figure 6
Figure 6
Optical micrograph (top left) and scattered X-ray (XS) and XRF elemental distribution maps of Cu, Zn, and Se (log scale and linear scale) of an A549 cell treated with 5 μM selenite for 24 h. Cu (red), Zn (green), and Se (blue) maps are overlaid to show the colocalization of the elements (Cu/Zn/Se).
Figure 7
Figure 7
Se K-edge μ-XANES spectra of Se hotspots in an A549 cell treated with 5 μm selenite. The experimental spectra (a and b, black) are overlaid with the spectra of elemental Se (red) and GSSeSG (blue). The optical micrograph (top left) and scattered X-ray (XS) and elemental distribution maps of S and Se of the cell are shown with arrows indicating the locations from which spectra (a) and (b) were collected.

References

    1. Ganther HE. Carcinogenesis. 1999;20:1657–1666. - PubMed
    1. Combs G, Gray W. Pharmacol Ther. 1998;79:179–192. - PubMed
    1. Kim E, Sohn S, Kwon H, Kim S, Kim M. Cancer Res. 2007 - PubMed
    1. Xiang N, Zhao R, Zhong W. Cancer Chemother Pharmacol. 2009;63:351–362. - PMC - PubMed
    1. Olm E, Fernandes AP, Hebert C, Rundlöf AK, Larsen EH, Danielsson O, Björnstedt M. Proc Natl Acad Sci U S A. 2009;106:11400–11405. - PMC - PubMed

Publication types

MeSH terms