Comparative Study
. 2011 Sep 29;12(9):R97.
doi: 10.1186/gb-2011-12-9-r97.

A comparative analysis of exome capture

Affiliations
Comparative Study

A comparative analysis of exome capture

Jennifer S Parla et al. Genome Biol. .

Abstract

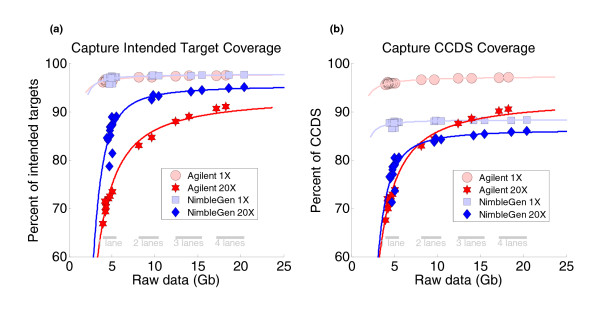
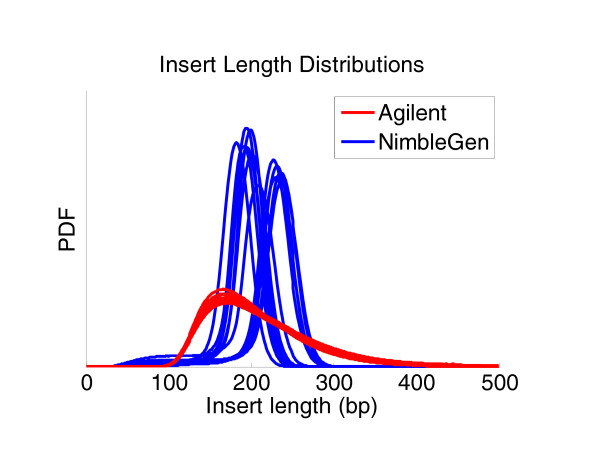
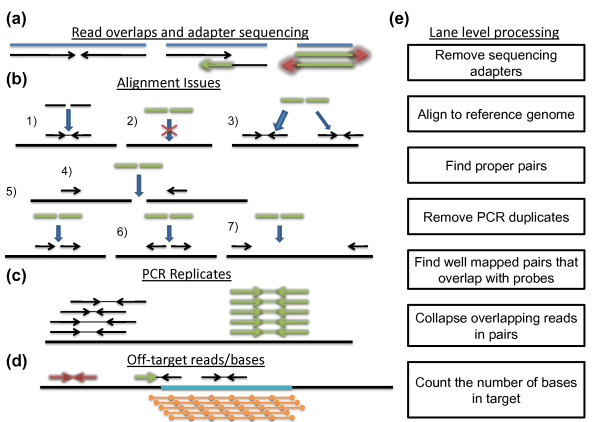
Background: Human exome resequencing using commercial target capture kits has been and is being used for sequencing large numbers of individuals to search for variants associated with various human diseases. We rigorously evaluated the capabilities of two solution exome capture kits. These analyses help clarify the strengths and limitations of those data as well as systematically identify variables that should be considered in the use of those data.

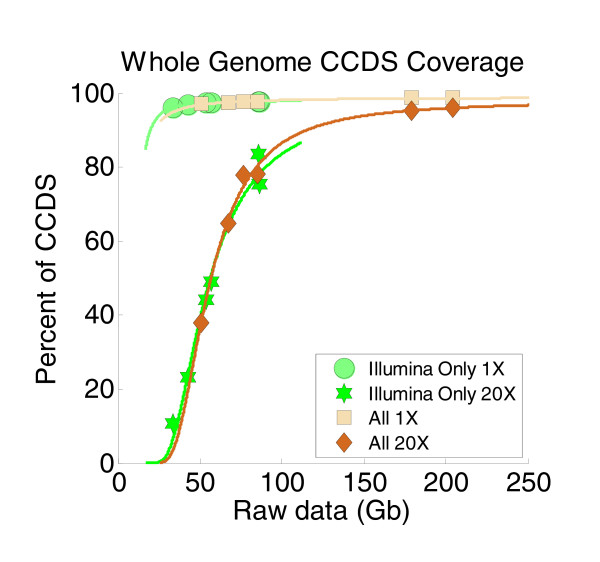
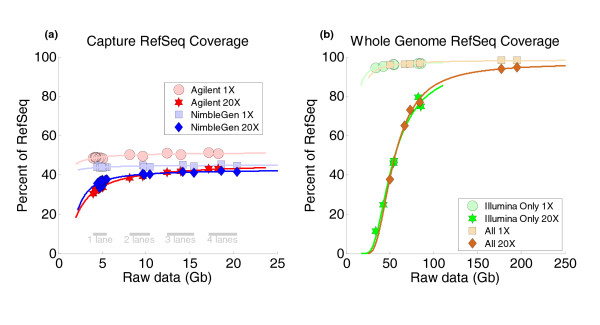
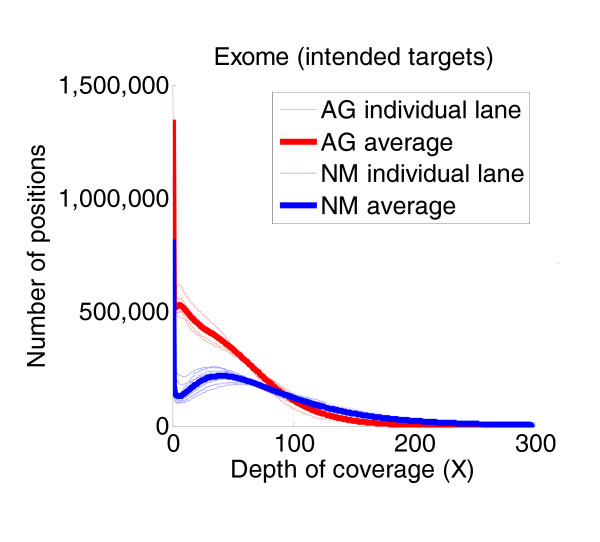
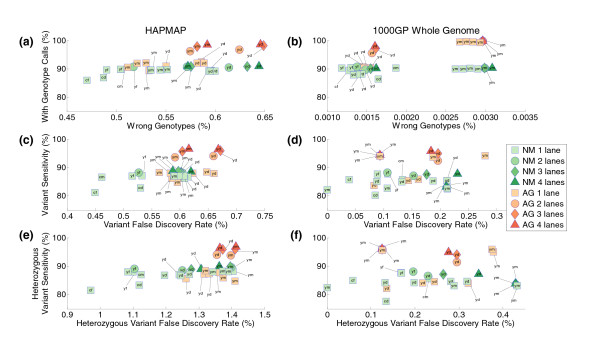
Results: Each exome kit performed well at capturing the targets they were designed to capture, which mainly corresponds to the consensus coding sequences (CCDS) annotations of the human genome. In addition, based on their respective targets, each capture kit coupled with high coverage Illumina sequencing produced highly accurate nucleotide calls. However, other databases, such as the Reference Sequence collection (RefSeq), define the exome more broadly, and so not surprisingly, the exome kits did not capture these additional regions.

Conclusions: Commercial exome capture kits provide a very efficient way to sequence select areas of the genome at very high accuracy. Here we provide the data to help guide critical analyses of sequencing data derived from these products.


Figures

Figure 1
Figure 1
Targeting efficiency and capability varied between commercially available exome capture kits. (a) The intended targets of the NimbleGen and Agilent exome kits were 26,227,295 bp and 37,640,396 bp, respectively. Both exome kits captured similarly high amounts (up to about 97%) of their intended targets at 1× depth or greater, but the NimbleGen kit was able to reach saturation of target coverage at 20× depth more efficiently than the Agilent kit. The NimbleGen exome kit required less raw data to provide sufficient coverage of the exome and to support confident genotype analysis. (b) Both exome kits were designed to target exons based on the June 2008 version of CCDS, which consisted of 27,515,053 bp of genomic space. Notably, the NimbleGen target was smaller than the CCDS, while the Agilent target was larger than the CCDS. Based on 1× depth sequence coverage, the Agilent exome kit captured more of the CCDS than the NimbleGen exome kit (97% covered by Agilent versus 88% covered by NimbleGen), but the NimbleGen kit was more efficient at capturing the regions of the CCDS it had the capability to capture.
Figure 2
Figure 2
With enough raw data, whole genome sequencing could achieve almost complete coverage of the CCDS (intended target of the exome capture kits). Approximately 98% of CCDS was covered at 1× or greater and approximately 94% covered at 20× or greater from the more deeply sequenced daughter samples. To generate this plot depicting the relationship between CCDS coverage depth and raw sequence data input, we imposed a coverage model based on two assumptions: that CCDS coverage depth should match genome coverage depth, and that genome size (3 Gb) times the desired coverage depth is the amount of raw sequence data (in gigabases) necessary to achieve such depth. Illumina Only, only the alignment files from Illumina sequence data were used; All, alignment files from Illumina, 454, and SOLiD sequence data were used.
Figure 3
Figure 3
Exome coverage, based on RefSeq sequences, was incomplete with exome capture but nearly complete with whole genome resequencing. (a) Since the CCDS only includes very well annotated protein-coding regions, we assessed exome kit coverage of the more comprehensive RefSeq sequences, which include protein-coding exons, non-coding exons, 3' and 5' UTRs, and non-coding RNAs, and encompass 65,545,985 bp of genomic space. Coverage of RefSeq sequences by the exome kits was clearly incomplete, with at most 50% of RefSeq covered at 1× depth or greater. (b) In contrast, coverage of RefSeq by whole genome data from the trio pilot of the 1000 Genomes Project was nearly complete, with approximately 98% of RefSeq covered at 1× or greater and approximately 94% covered at 20× or greater from the more deeply sequenced daughter samples. This plot uses an identical format to the one used in Figure 2; see the caption of Figure 2 for detailed description.
Figure 4
Figure 4
Insert size distributions differed between the sample libraries prepared for the NimbleGen and Agilent exome capture kits. Sample libraries were produced independently and were prepared according to the manufacturer's guidelines. The insert size distributions were generated based on properly mapped and paired reads determined by our capture analysis pipeline. The NimbleGen library preparation process involved agarose gel electrophoresis-based size selection, whereas the Agilent process involved a more relaxed, bead-based size selection using AMPure XP (Beckman Coulter Genomics). Bead-based size selection is useful for removing DNA fragments smaller than 100 bp but less effective than gel-based size selection in producing narrow size distributions. Yet, from a technical standpoint, the gel-based process is more susceptible to variability of mean insert size. The two different size selection processes are illustrated by our group of NimbleGen capture libraries and our group of Agilent capture libraries. PDF, probability distribution function.
Figure 5
Figure 5
Uniformity plots of exome capture data revealed fundamental differences in uniformity of target coverage between exome capture platforms. The numbers of platform-specific target bases covered from 0× to 300× depth coverage are plotted for NimbleGen (NM) and Agilent (AG) exome captures. The NimbleGen exome data were more efficient at covering the majority of intended target bases, but the corresponding uniformity plots from these data revealed that there was also some over-sequencing of these positions, which thus broadened the coverage distribution for the NimbleGen targets. The Agilent exome data, however, showed significantly more target bases with no coverage or very poor coverage compared to the NimbleGen data, thus indicating that the Agilent data provided less uniform target coverage than the NimbleGen data. The lower uniformity of coverage produced from the Agilent captures results in the need to provide more raw sequence data in order to generate adequate coverage of targets. The Agilent platform was thus less efficient at target capture than the NimbleGen platform.
Figure 6
Figure 6
Depth correlation plots prepared from exome capture data revealed that artificial background noise arising from the use of target capture kits might be problematic. (a) Correlations of target base coverage depth between four independent NimbleGen captures with the daughter sample from the YRI trio (YRI-D-NM). Two different lots of NimbleGen exome probe libraries were used for this analysis, and correlation anomalies were only observed when comparing data between the two lots. YRI-D-NM-LN1 was captured with one lot and YRI-D-NM-LN2, YRI-D-NM-LN3, and YRI-D-NM-LN4 were captured with the other. (b) Correlations of target base coverage depth between four independent Agilent captures with the daughter sample from the YRI trio (YRI-D-AG). Only one lot of Agilent exome probe library was used for this analysis, and data between different captures consistently correlated well. AG, Agilent exome; D, YRI daughter; LN, lane; NM, NimbleGen exome; r, correlation coefficient.
Figure 7
Figure 7
Assessments of the genotyping performance of exome capture and resequencing over the CCDS target. Exome capture sequence data were analyzed using our capture analysis pipeline (see Materials and methods; Figure 8), and genotype calls with consensus quality of at least 50 were used to determine the utility of solution exome capture for proper genotyping. These tests were performed with genotype gold standards prepared from the HapMap 3 panel and the trio pilot of 1000 Genomes Project (1000GP) for the two CEU and YRI trios used for this study (Table 3). In all panels, the color of the symbols designates the platform used, with green representing the NimbleGen platform (NM) and red representing the Agilent platform (AG). The label associated with the symbol identifies the sample using a two-letter code: the first letter identifies the trio (y for YRI and c for CEU) and the second letter identifies the family member (m for mother, f for father, and d for daughter). The shape of the symbols specifies the number of lanes of data used (rectangle for one lane, circle for two lanes, diamond for three lanes, and triangle for four lanes). (a, b) The y-axes show the percentage of the HapMap (a) and 1000 Genomes Project (b) gold standard positions that were successfully genotyped with a minimum consensus of 50; the x-axes show the percent of the called genotypes that disagree with the given gold standard genotypes. (c, d) Plots of sensitivity versus false discovery rates for the task of identifying variants: HapMap (c); 1000 Genomes Project (d). Sensitivity is defined as the percentage of positions with a variant genotype in the gold standard that have been called as variants from the exome capture data. The false discovery rate is defined as the percentage of variant calls from the exome capture data over the gold standard positions that do not have a variant genotype in the gold standard. (e, f) Plots of sensitivity versus false discovery rates for the task of identifying heterozygous variants: HapMap (e); 1000 Genomes Project (f).
Figure 8
Figure 8
Description of the lane-level processing of our analysis pipeline. (a-d) The issues that our lane-level processing addresses. (a) Insert length-related complications. (b) The various ways a pair of reads can align, with 1) showing a proper-pair alignment. (c) How PCR duplicates look after alignment. (d) A cartoon of off-target reads and off-target bases of on-target reads. (e) The steps we take to address the issues demonstrated in (a-d). See the Materials and methods section for detailed descriptions.

References

    1. Albert TJ, Molla MN, Muzny DM, Nazareth L, Wheeler D, Song X, Richmond TA, Middle CM, Rodesch MJ, Packard CJ, Weinstock GM, Gibbs RA. Direct selection of human genomic loci by microarray hybridization. Nat Methods. 2007;4:903–905. doi: 10.1038/nmeth1111. - DOI - PubMed
    1. Hodges E, Rooks M, Xuan Z, Bhattacharjee A, Benjamin Gordon D, Brizuela L, Richard McCombie W, Hannon GJ. Hybrid selection of discrete genomic intervals on custom-designed microarrays for massively parallel sequencing. Nat Protoc. 2009;4:960–974. doi: 10.1038/nprot.2009.68. - DOI - PMC - PubMed
    1. Hodges E, Xuan Z, Balija V, Kramer M, Molla MN, Smith SW, Middle CM, Rodesch MJ, Albert TJ, Hannon GJ, McCombie WR. Genome-wide in situ exon capture for selective resequencing. Nat Genet. 2007;39:1522–1527. doi: 10.1038/ng.2007.42. - DOI - PubMed
    1. Okou DT, Steinberg KM, Middle C, Cutler DJ, Albert TJ, Zwick ME. Microarray-based genomic selection for high-throughput resequencing. Nat Methods. 2007;4:907–909. doi: 10.1038/nmeth1109. - DOI - PubMed
    1. Ng SB, Turner EH, Robertson PD, Flygare SD, Bigham AW, Lee C, Shaffer T, Wong M, Bhattacharjee A, Eichler EE, Bamshad M, Nickerson DA, Shendure J. Targeted capture and massively parallel sequencing of 12 human exomes. Nature. 2009;461:272–276. doi: 10.1038/nature08250. - DOI - PMC - PubMed

Publication types

LinkOut - more resources