. 2011 Dec;49(6):1279-89.
doi: 10.1016/j.bone.2011.09.042. Epub 2011 Sep 18.

Mechanical property and tissue mineral density differences among severely suppressed bone turnover (SSBT) patients, osteoporotic patients, and normal subjects

Affiliations

Mechanical property and tissue mineral density differences among severely suppressed bone turnover (SSBT) patients, osteoporotic patients, and normal subjects

Crystal K Tjhia et al. Bone. 2011 Dec.

Abstract

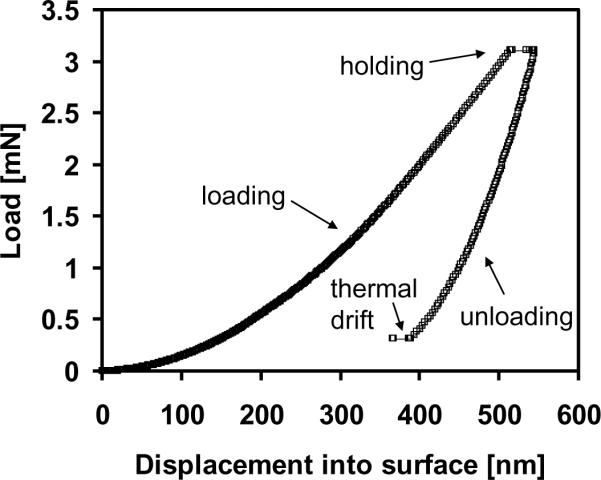
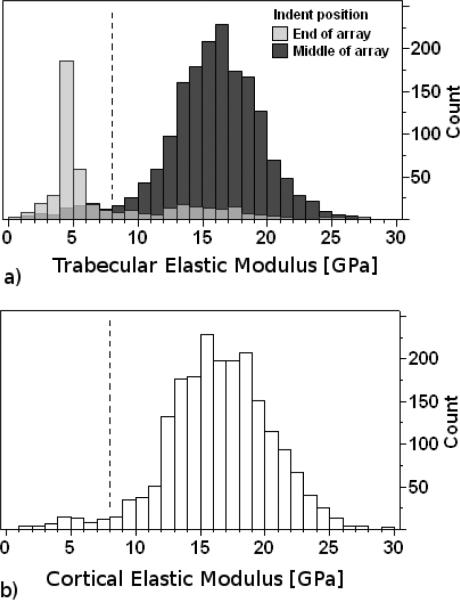
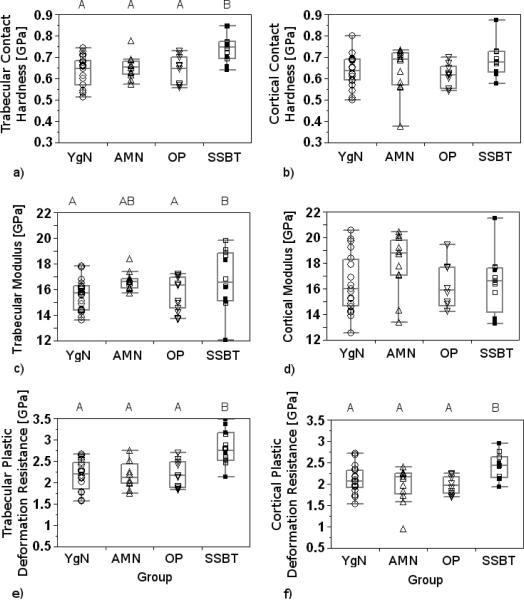
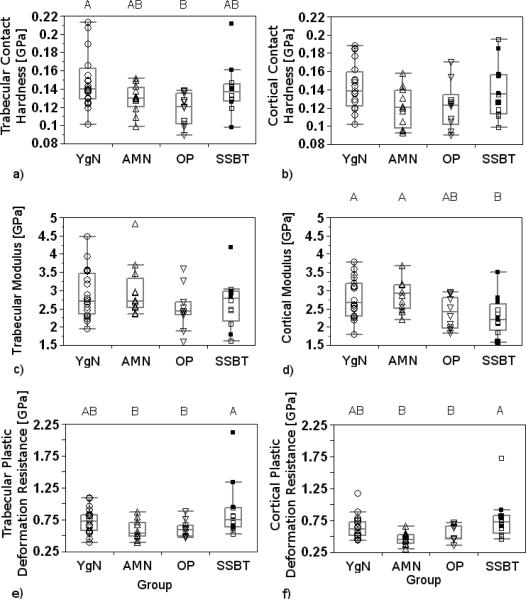
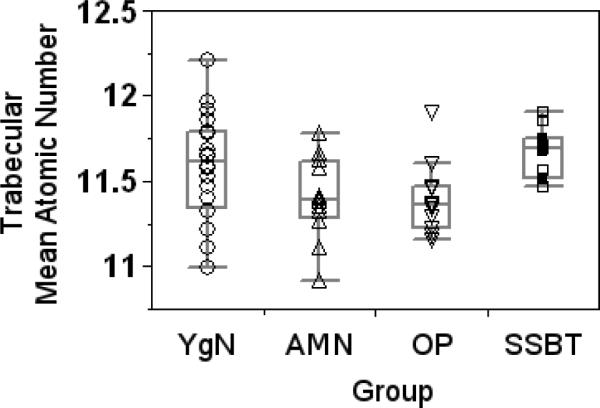
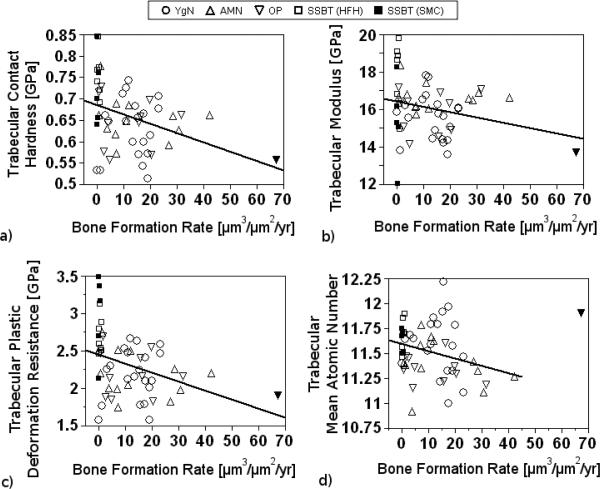
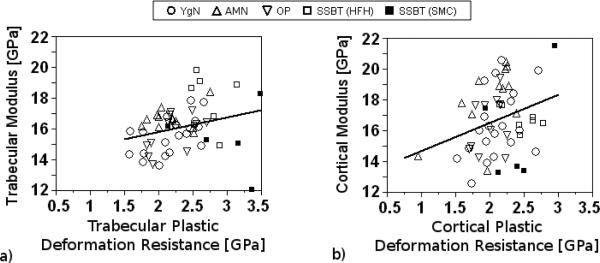
Pathogenesis of atypical fractures in patients on long term bisphosphonate therapy is poorly understood, and the type, the manner in which they occur and the fracture sites are quite different from the usual osteoporotic fractures. We hypothesized that the tissue-level mechanical properties and mean degree of mineralization of the iliac bone would differ among 1) patients with atypical fractures and severely suppressed bone turnover (SSBT) associated with long-term bisphosphonate therapy, 2) age-matched, treatment-naïve osteoporotic patients with vertebral fracture, 3) age-matched normals and 4) young normals. Large differences in tissue-level mechanical properties and/or mineralization among these groups could help explain the underlying mechanism(s) for the occurrence of typical osteoporotic and the atypical femoral shaft fractures. Elastic modulus, contact hardness, plastic deformation resistance, and tissue mineral densities of cortical and trabecular bone regions of 55 iliac bone biopsies--12 SSBT patients (SSBT; aged 49-77), 11 age-matched untreated osteoporotic patients with vertebral fracture (Osteoporotic), 12 age-matched subjects without bone fracture (Age-Matched Normal), and 20 younger subjects without bone fracture (Young Normal)--were measured using nanoindentation and quantitative backscattered electron microscopy. For cortical bone nanoindentation properties, only plastic deformation resistance was different among the groups (p<0.05), with greater resistance to plastic deformation in the SSBT group compared to all other groups. For trabecular bone, all nanoindentation properties and mineral density of the trabecular bone were different among the groups (p<0.05). The SSBT group had greater plastic deformation resistance and harder trabecular bone compared to the other three groups, stiffer bone compared to the Osteoporotic and Young Normal groups, and a trend of higher mineral density compared to the Age-Matched Normal and Osteoporotic groups. Lower heterogeneity of modulus and contact hardness for cortical bone of the SSBT and trabecular bone of the Osteoporotic fracture groups, respectively, compared to the non-fractured groups, may contribute to fracture susceptibility due to lowered ability to prevent crack propagation. We tentatively conclude that, in addition to extremely low bone formation rate, atypical fractures in SSBT and/or long-term bisphosphonate treatment may be associated with greater mean plastic deformation resistance properties and less heterogeneous elastic properties of the bone.


Figures

Fig. 1
Fig. 1
Representative nanoindentation load-displacement curve for 500 nm indent. Berkovich diamond tip loaded into the surface at a target strain rate of 0.05 s−1 to 500 nm depth. Tip was held at maximum load for 10 seconds, unloaded and held at 10% of maximum load for 100 seconds to calculate thermal drift. Elastic modulus and contact hardness were calculated from the unloading portion of the curve.
Fig. 2
Fig. 2
Image of a single trabecula from a biopsy imaged using the 10× objective in the nanoindenter. Example of a series of indentations shown in white triangles. Black scale bar represents 100 μm length. Indents in plastic regions (unfilled white triangles) were not included in the analysis. Spacing between indents was a minimum of 20 μm.
Fig. 3
Fig. 3
Histograms of elastic modulus values for all indents made in trabecular (a) and cortical (b) bone regions. Some mechanical property data from the thin edges of sectioned bone and from plastic entered into the data set as a result of the intention to indent across regions of bone tissue by starting and ending in the plastic region (Fig. 2). When the initial and final indents of each linear array were removed from the data set, the peak centered at the low modulus region (4 to 5 GPa) was greatly reduced (a; dark grey bars). In addition to indentations made in the plastic regions, other low modulus values were likely from indentations in lacunae and cracks (a; light grey bars). Low modulus values were indistinguishable from the modulus of the embedding material (4.15 and 2.02 GPa for HFH and SMC biopsies, respectively), thus these values were filtered out of the data set. Medium gray areas (a) show the overlapping regions of the 2 distributions. Data below 8 GPa (dotted black line) were eliminated from the analysis. Cortical bone indents below 8 GPa were not included in the analysis of cortical bone properties (b).
Fig. 4
Fig. 4
Backscattered electron microscope image of a trabecula of one biopsy. Grayscale levels correlate with the degree of mineralization. Lighter regions represent areas of higher mineral density than darker regions. Images were captured at 300×. Scale bar represents 100 μm.
Fig. 5
Fig. 5
Box plots of contact hardnesses (a, b), elastic moduli (c, d), and plastic deformation resistances (e, f) of trabecular (a, c, e) and cortical bone (b, d, f) averaged by biopsy and reported by Group (YgN=Young Normals, AMN=Age-Matched Normals, OP=Osteoporotic, SSBT=Severely Suppressed Bone Turnover). Biopsies from Southwestern Medical Center (SMC) are represented by filled squares (■). All other biopsies were from Henry Ford Hospital (HFH). Groups with significantly different mechanical properties, when both SMC and HFH biopsies were included in the analysis, are denoted with different letters (Tukey post hoc tests). Significance level for all tests was α=0.05.
Fig. 6
Fig. 6
The average standard deviations of trabecular contact hardness (a), trabecular plastic deformation resistance (e), cortical modulus (d), and cortical plastic deformation (f) were significantly different among the four groups (ANOVA, p=0.012, p=0.015, p=0.011, p=0.003, respectively). Significance level for all tests was α=0.05. Groups with significantly different within-individual variability in properties are denoted with different letters (Tukey's HSD).
Fig. 7
Fig. 7
Mean mineral density of trabecular bone was significantly different among groups (ANOVA, p=0.018). There was a trend of higher mineral density in the trabecular bone of the SSBT group compared to the age-matched normal and osteoporotic groups (Tukey's HSD, p=0.059 and 0.062, respectively). Significance level for all tests was α=0.05.
Fig. 8
Fig. 8
Trabecular contact hardness (a) and plastic deformation resistance (c) were each significantly but weakly correlated with BFR using simple linear regression (p=0.006, r2adj=0.12, and p=0.007, r2adj=0.11, respectively). Trabecular modulus and BFR (b) were not significantly associated but exhibited a trend for a weak association (p=0.08, r2adj=0.04). Trabecular mineral density and BFR (c) were significantly, but weakly, associated (p=0.038, r2adj=0.06) when one outlier (▼), an osteoporotic biopsy, was excluded from the analysis. The outlier was included in the analyses of the other regressions. Relationships between cortical bone tissue properties and BFR were not significant (not shown).
Fig. 9
Fig. 9
Regressions between modulus and plastic deformation resistance were significant but weak for trabecular (a) and cortical (b) regions (p=0.046, r2adj = 0.06 , and p=0.034, r2adj = 0.07, respectively).

References

    1. Kanis JA, Melton LJ, 3rd, Christiansen C, Johnston CC, Khaltaev N. The diagnosis of osteoporosis. J Bone Miner Res. 1994;9:1137–41. - PubMed
    1. Abrahamsen B, Eiken P, Eastell R. Cumulative Alendronate Dose and the Long-Term Absolute Risk of Subtrochanteric and Diaphyseal Femur Fractures: A Register-Based National Cohort Analysis. J Clin Endocrinol Metab - PMC - PubMed
    1. Black DM, Kelly MP, Genant HK, Palermo L, Eastell R, Bucci-Rechtweg C, Cauley J, Leung PC, Boonen S, Santora A, de Papp A, Bauer DC. Bisphosphonates and Fractures of the Subtrochanteric or Diaphyseal Femur. N Engl J Med. 2010 - PubMed
    1. Girgis CM, Sher D, Seibel MJ. Atypical femoral fractures and bisphosphonate use. N Engl J Med. 2010;362:1848–9. - PubMed
    1. Lenart BA, Lorich DG, Lane JM. Atypical fractures of the femoral diaphysis in postmenopausal women taking alendronate. N Engl J Med. 2008;358:1304–6. - PubMed

Publication types