. 2012 Jan;50(1):42-53.
doi: 10.1016/j.bone.2011.09.038. Epub 2011 Sep 20.

Meox2Cre-mediated disruption of CSF-1 leads to osteopetrosis and osteocyte defects

Affiliations

Meox2Cre-mediated disruption of CSF-1 leads to osteopetrosis and osteocyte defects

Stephen E Harris et al. Bone. 2012 Jan.

Abstract

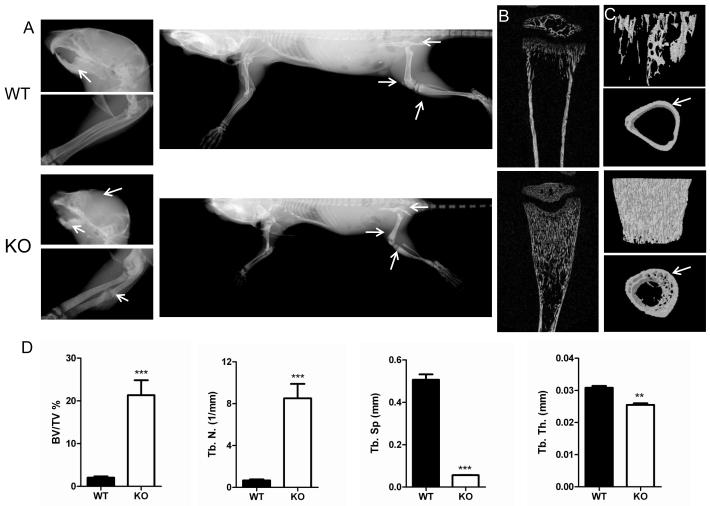
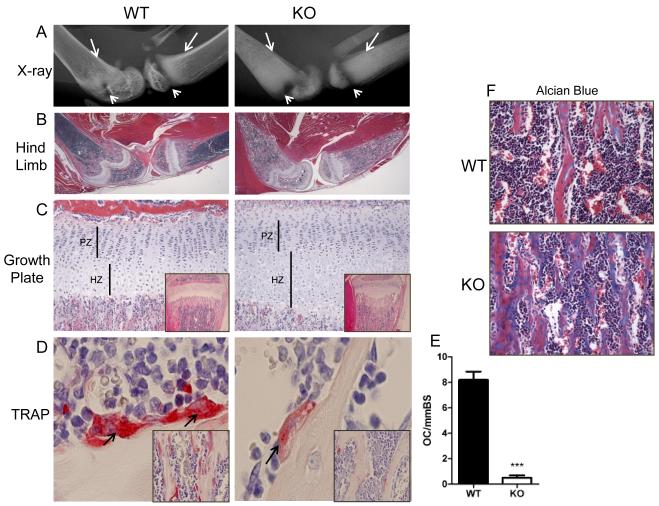
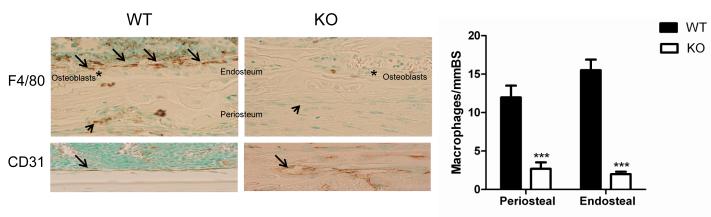
CSF-1, a key regulator of mononuclear phagocyte production, is highly expressed in the skeleton by osteoblasts/osteocytes and in a number of nonskeletal tissues such as uterus, kidney and brain. The spontaneous mutant op/op mouse has been the conventional model of CSF-1 deficiency and exhibits a pleiotropic phenotype characterized by osteopetrosis, and defects in hematopoiesis, fertility and neural function. Studies to further delineate the biologic effect of CSF-1 within various tissues have been hampered by the lack of suitable models. To address this issue, we generated CSF-1 floxed/floxed mice and demonstrate that Cre-mediated recombination using Meox2Cre, a Cre line expressed in epiblast during early embryogenesis, results in mice with ubiquitous CSF-1 deficiency (CSF-1KO). Homozygous CSF-1KO mice lacked CSF-1 in all tissues and displayed, in part, a similar phenotype to op/op mice that included: failure of tooth eruption, osteopetrosis, reduced macrophage densities in reproductive and other organs and altered hematopoiesis with decreased marrow cellularity, circulating monocytes and B cell lymphopoiesis. In contrast to op/op mice, CSF-1KO mice showed elevated circulating and splenic T cells. A striking feature in CSF-1KO mice was defective osteocyte maturation, bone mineralization and osteocyte-lacunar system that was associated with reduced dentin matrix protein 1 (DMP1) expression in osteocytes. CSF-1KO mice also showed a dramatic reduction in osteomacs along the endosteal surface that may have contributed to the hematopoietic and cortical bone defects. Thus, our findings show that ubiquitous CSF-1 gene deletion using a Cre-based system recapitulates the expected osteopetrotic phenotype. Moreover, results point to a novel link between CSF-1 and osteocyte survival/function that is essential for maintaining bone mass and strength during skeletal development.


Figures

Fig. 1
Fig. 1
Targeted disruption of the mouse CSF-1 gene: absent circulating CSF-1, decreased growth rate, failure of tooth eruption. A) CSF-1 fx/fx targeting vector and WT allele showing exons 1 to 9, restriction enzyme sites, loxP sites, neomycin resistance cassette and probes used for Southern blot (5′ Spe1 and 3′ BglII probes). B) Southern blot analysis of genomic DNA from G418-resistant ES cell clones using the probes shown in A. Asterisks indicate clones with correctly targeted allele. C) Serum CSF-1 concentration of WT and CSF-1KO mice measured by ELISA. Mean ± SE (n = 3 mice for each genotype) ***p<0.001 WT vs CSF-1KO. D) CSF-1 mRNA expression in primary calvarial osteoblasts by RT-PCR. WT, but not CSF-1KO, mice show the 381 kDa CSF-1 band. The 18S control is shown in lower panel. E) Growth curves for mice weighed at weekly intervals from 1 to 3 weeks of age. Mean ± SE (n = 16 mice for each genotype) ***p<0.001 WT vs CSF-1KO. F) Tooth phenotype: incisors failed to erupt in CSF-1KO mice.
Fig. 2
Fig. 2
Comparative x-ray, microCT and morphometric bone parameters in WT and CSF-1KO mice. A) Representative x-ray images of head (arrows indicate domed skull and sclerotic alveolar bone with unerupted teeth in CSF-1KO), forelimbs (arrows indicate spontaneous fracture in CSF-1KO) and whole body (arrows indicate sclerosis in iliac crest, femoral and tibial metaphysis in CSF-1KO). Representative B) 2-D microCT images of tibias and C) 3-D anterior-posterior microCT views of the tibial metaphyses (upper panel) and cortical bone slices along the diaphysis (lower panel). CSF-1KO mice show dramatically increased trabecular bone and decreased cortical thickness (arrows) compared to WT. D) 3-D trabecular structure parameters calculated in a defined VOI in proximal tibias included: percent bone volume/tissue volume [% BV/TV], trabecular number [Tb.N], trabecular space [Tb. S], trabecular thickness [Tb. Th.]). Bar graphs show Mean ± SE (n = 3-4 mice for each genotype) ***p<0.001, **p<0.01 WT vs CSF-1KO.
Fig. 3
Fig. 3
Hind limb x-ray and histology of cartilage and osteoclasts in WT and CSF-1KO mice. A) Representative high power x-ray images of femur and tibia (arrows indicate poor demarcation between cortical bone and marrow cavity in CSF-1KO; arrowheads indicate expanded radiolucent growth plate in CSF-1KO). B) Low power images of H&E stained sections of the same hindlimbs shown in A cut in the midsagittal plane. C) High power images of epiphyseal regions (PZ, proliferating zone; HZ, hypertrophic zone; inset, low power photomicrograph showing expanded growth plate and bone trabeculae obliterating marrow cavity in CSF-1KO). D) TRAP stain (arrows indicate strong TRAP+ multinucleated osteoclasts in WT and weak TRAP+ mononucleated osteoclasts in CSF-1KO; inset shows numerous osteoclasts along bone trabeculae in WT, whereas rare TRAP+ cells are visualized in CSF-1KO). E) Histomorphometric quantification of TRAP+ osteoclasts (OC) per mm bone surface (BS) in WT and CSF-1KO. Mean ± SE (n = 4 mice for each genotype) ***p<0.001 WT vs CSF-1KO. F) Alcian Blue stain demonstrates unmineralized bone trabeculae (stains blue) in CSF-1KO. Original magnification: B: x1.25, C: x10 (inset x4), D: x40 (inset x20), F: x20.
Fig. 4
Fig. 4
Osteoblast and osteocyte defects in CSF-1KO mice. Comparative histology of WT and CSF-1KO metaphysis. A) WT is composed of organized trabeculae parallel to the longitudinal axis of the tibia, whereas metaphyseal bone in CSF-1KO shows a meshwork of irregularly shaped trabeculae with transverse connections between trabeculae. Osteoblast and osteocyte morphology. B) Osteoblasts in CSF-1KO are abnormally clustered, disorganized and lack the normal polarity of WT osteoblasts (circles). C, left panels) WT osteoblasts (asterisks) show directional matrix deposition and normal differentiation into osteocytes; a single osteocyte is identified in lacunae (arrows). CSF-1KO osteoblasts (asterisks) show impaired transition to osteocytes; clusters of abnormally shaped osteocytes are identified in lacunae (arrows). C, right panels) DMP1 immunohistochemistry (upper panel) and in situ hybridization (lower panel): Compared to WT, DMP1 protein (brown color) and mRNA expression (dark blue color) in CSF-1KO osteocytes are dramatically reduced (arrows). D) CSF-1KO osteoblasts (arrow) become more flattened and focally detached in the diaphysis. E) In some foci, bone marrow cells and endothelial cells of vessels in CSF-1KO directly contact bone surfaces (arrows). Original magnification: A: x10, B: x40, C: x40, D: x10, F: x20. BM, bone marrow; EC, endothelial cell.
Fig. 5
Fig. 5
Altered vascularity, cortical bone and osteocyte viability in CSF-1KO mice. A) CD31+ immunostain of tibial metaphysis. Vascular sinusoids are narrowed in CSF-1KO compared to widely patent vessels in WT (brown color, arrows). B) H&E sections of cortical bone. WT cortical bone is dense with regularly interspersed osteocytes and the endosteal surface is lined by a uniform layer of osteoblasts (arrow). CSF-1KO cortical bone is thinner (bar), less dense than WT, contains few randomly interspersed osteocytes and the endosteal surface is lined by disorganized osteoblasts (arrow). C) Collagen fibrils visualized under polarized light. WT cortical bone shows dense, parallel arrangement of collagen fibrils, whereas in CSF-1KO, collagen fibrils are decreased, shortened and disorganized. D) TUNEL analysis for apoptosis. WT bone showed rare apoptotic osteocytes whereas CSF-1KO showed increased osteocyte apoptosis (brown stain, arrows). Inset shows karyorrhexis of apoptotic nuclei. E) Histomorphometric quantification of TUNEL. Apoptotic osteocytes were significantly increased in CSF-1KO bone. Mean ± SE (n = 4 mice for each genotype) ***p<0.001 WT vs CSF-1KO.
Fig. 6
Fig. 6
Impaired osteocyte maturation and lacunar-canalicular system in CSF-1KO mice. Toluidine blue stained sections (A), TEM (B,C) and SEM (D,E) images of WT and CSF-1KO bone. A) WT shows well-organized trabecular and cortical bone with osteocytes in lacunae, whereas CSF-1KO shows poor demarcation between trabecular and cortical bone and several empty lacunae (arrows). B,C) WT osteoblasts are layered along bone surfaces with one side adjacent to the bone surface indicating their polarity, whereas CSF-1KO osteoblasts are irregularly shaped and disorganized. Micropetrosis was identified in CSF-1KO by mineralization of lacunar spaces (arrow). WT osteocytes were embedded in well-mineralized matrix and showed well-developed dendritic processes (arrows). Osteocytes in CSF-1KO were surrounded by patchy mineralized matrix (arrowhead) and showed poorly formed dendrites (arrows). D) Backscattered SEM and E) SEM of acid-etched, resin-casted osteocyte lacunar-canalicular system. Note that CSF-1KO osteocyte lacunae are disorganized, decreased in number and have rough walls. There is also a large amount of osteoid present in the matrix. TB, trabecular bone; CB, cortical bone, OB, osteoblast; OC, osteocyte.
Fig. 7
Fig. 7
Dental defects and deficiency of tissue macrophages in CSF-1KO mice. A,B) H&E stained sections of first molars. CSF-1KO mice show impaired root formation (arrows) compared to WT and a narrow dental follicle (bars) invaded by bone (arrows). B) Dentin morphology. CSF-1KO shows a widened predentin layer (bar) with an irregular mineralization front and unevenly mineralized dentin (irregular light and dark staining). C,D) Immunostain and quantification of F4/80+ macrophages in dental pulp. Macrophages are dramatically reduced in CSF-1KO pulp compared to WT (brown color). Mean ± SE (n = 4 mice for each genotype) ***p<0.001. E-I) Quantification of F4/80 cell densities in tissues (bar graphs) and representative F4/80 immunostained sections of lung, liver, skin, testes, uterus, synovium and spleen are shown. CSF-1KO mice show decreased macrophages in: lung alveoli (arrow), Kuppfer cells in liver surrounding central vein (arrow), skin dermis associated with reduced dermal thickness (bar), testes adjacent to Leydig cells (arrow), uterus (arrow), synovial membrane (arrow) and spleen. Original magnification A, x4, B, C, F, G, x20. Bar graph shows mean macrophages/mm2 ± SE (n = 3-5 mice for each genotype) *p<0.05, **p<0.001, ***p<0.001 WT vs CSF-1KO. DF, dental follicle; PD, predentin; D, dentin.
Fig. 8
Fig. 8
Endosteal and periosteal F4/80 macrophages in CSF-1KO and WT mice. Immunostained cortical bone sections and quantification of F4/80+ macrophages (bar graph) are shown. Upper panel: Osteomacs in WT mice are identified as a canopy of cells covering osteoblasts along the endosteal surface (arrows); F4/80+ macrophages are also present along the periosteum (arrowhead). Osteomacs and periosteal macrophages are decreased in CSF-1KO mice. Original magnification x20. Bar graph shows mean macrophages/mm bone surface (BS) ± SE (n = 5 mice for each genotype) ***p<0.001 WT vs CSF-1KO. Lower panel: CD31 immunostain of WT and CSF-1KO endosteal surface shows abnormal vascular pattern in CSF-1KO. Asterisks indicate osteoblasts.
Fig. 9
Fig. 9
Myeloid and lymphoid lineage parameters in WT and CSF-1KO mice. A) Average number ± SE of mononuclear cells (MNC), B220+ and CD11b+Gr1+ cells in the bone marrow. Representative FACS profiles of B) B cells (B220+) and C) myeloid cells (CD11b+Gr1+) in the bone marrow, D) myeloid cells (CD11b+Gr1+) in the spleen, E) CD11b+Gr1−, CD11b+Gr1lo, CD11b+Gr1hi myeloid subpopulations in the peripheral blood and F) B cells (B220+) and T cells (CD3+) in the spleen. The percentage of positive cells is shown within each FACS profile. The means and percentages from FACS analysis for 6 mice of each genotype are presented in Table 1.

References

    1. Yeung Y-G, Stanley ER. Proteomics approaches to the analysis of early events in colony-stimulating factor-1 signal transduction. Mol Cell Proteomics. 2003;2:1143–1155. - PubMed
    1. Rettenmier CW, Roussel MF. Differential processing of colony-stimulating factor 1 precursors encoded by two human cDNAs. Mol Cell Biol. 1998;8:5026–5034. - PMC - PubMed
    1. Price LKH, Choi HU, Rosenberg L, Stanley ER. The predominant form of secreted colony stimulating factor is a proteoglycan. J Biol Chem. 1992;267:2190–2199. - PubMed
    1. Theoleyre S, Wittrant Y, Tat SK, Fortun Y, Redini F, Heymann D. The molecular triad OPG/RANK/RANKL: involvement in the orchestration of pathophysiological bone remodeling. Cytokine Growth Factor Rev. 2004;15:457–475. - PubMed
    1. Heino TJ, Kurata K, Higaki H, Vaananen HK. Evidence of a role of osteocytes in the initiation of targeted remodeling. Technology and Health Care. 2009;17:49–56. - PubMed

Publication types

MeSH terms