Pilot study to evaluate ecological momentary assessment of tinnitus
- PMID: 21960147
- PMCID: PMC3251738
- DOI: 10.1097/AUD.0b013e31822f6740
Pilot study to evaluate ecological momentary assessment of tinnitus
Abstract
Objectives: Because audiometric evaluation, symptom histories, questionnaires, and similar standard assessment tools may not adequately sample the effects of chronic tinnitus on day-to-day activities, there is a need for alternative methodological approaches to study the impact of tinnitus on day-to-day life. An innovative methodological approach that has shown great promise in the study of chronic health problems characterized by reported temporal and/or situational variability in symptoms and distress is known as ecological momentary assessment (EMA). EMA involves the real-time measurement of states, situational factors, and symptoms by individuals as they go about their day-to-day activities. The objective of this pilot investigation was to explore the feasibility of using EMA methods to examine within- and between-day effects of tinnitus.
Design: This study was conducted in three phases: (1) design and development of an EMA methodology that could be used to assess effects of tinnitus; (2) refinement of the methodology through the use of two focus groups; and (3) field-test the methodology with individuals who experienced bothersome tinnitus. For Phase 3, each of the 24 participants wore, throughout their waking hours for 2 weeks, a personal digital assistant that produced alerts four times a day. The alerts prompted participants to respond to 19 questions, including 9 relating to situational and mood factors and 10 comprising the Tinnitus Handicap Inventory-Screening version (THI-S). To evaluate for potential reactive effects of performing the EMA protocol, each participant completed the paper-and-pencil version of the full 25-item THI before and after the 2-week EMA period.
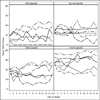
Results: Participants responded to the alerts with a 90% compliance rate, providing a total of 1210 completed surveys. At the time of their response, participants indicated that they were in their house or apartment (67.7%), alone (50.2%), happy (50%), and calm (54.5%). Across most responses, participants could hear their tinnitus (97%), and the loudness of their tinnitus averaged 4.7 on a 7-point increasing-loudness scale. The mean THI-S index score (out of a possible maximum 40 points for greatest tinnitus severity) was 17.0 (moderate self-perceived tinnitus handicap). Repeated THI-S index scores varied considerably both within and between participants. Mean 25-item THI scores were not significantly different before and after the EMA period, suggesting little reactivity of the EMA.
Conclusions: The high compliance rate, positive feedback from participants, lack of reactivity as a result of performing the EMA protocol, and data collected indicate that EMA methodology is feasible with patients who have tinnitus. Outcome data obtained with this methodology cannot be obtained any other way because retrospective questionnaires cannot capture the day-to-day reactions. This methodology has the potential to provide more in-depth and accurate assessments of patients receiving therapy for tinnitus.
Figures


Similar articles
-
Feasibility of ecological momentary assessment of hearing difficulties encountered by hearing aid users.Ear Hear. 2012 Jul-Aug;33(4):497-507. doi: 10.1097/AUD.0b013e3182498c41. Ear Hear. 2012. PMID: 22531573 Free PMC article.
-
Evaluation of Ecological Momentary Assessment for Tinnitus Severity.JAMA Otolaryngol Head Neck Surg. 2017 Jul 1;143(7):700-706. doi: 10.1001/jamaoto.2017.0020. JAMA Otolaryngol Head Neck Surg. 2017. PMID: 28448659 Free PMC article.
-
Development of the Tinnitus Handicap Inventory.Arch Otolaryngol Head Neck Surg. 1996 Feb;122(2):143-8. doi: 10.1001/archotol.1996.01890140029007. Arch Otolaryngol Head Neck Surg. 1996. PMID: 8630207
-
Folic acid supplementation and malaria susceptibility and severity among people taking antifolate antimalarial drugs in endemic areas.Cochrane Database Syst Rev. 2022 Feb 1;2(2022):CD014217. doi: 10.1002/14651858.CD014217. Cochrane Database Syst Rev. 2022. PMID: 36321557 Free PMC article.
-
Cognitive behavioural therapy for tinnitus.Cochrane Database Syst Rev. 2020 Jan 8;1(1):CD012614. doi: 10.1002/14651858.CD012614.pub2. Cochrane Database Syst Rev. 2020. PMID: 31912887 Free PMC article.
Cited by
-
Tinnitus: at a crossroad between phantom perception and sleep.Brain Commun. 2022 Apr 5;4(3):fcac089. doi: 10.1093/braincomms/fcac089. eCollection 2022. Brain Commun. 2022. PMID: 35620170 Free PMC article. Review.
-
Momentary Analysis of Tinnitus: Considering the Patient.Curr Top Behav Neurosci. 2021;51:383-401. doi: 10.1007/7854_2020_176. Curr Top Behav Neurosci. 2021. PMID: 32808091
-
Daily-Life Fatigue in Mild to Moderate Hearing Impairment: An Ecological Momentary Assessment Study.Ear Hear. 2020 Nov/Dec;41(6):1518-1532. doi: 10.1097/AUD.0000000000000888. Ear Hear. 2020. PMID: 33136628 Free PMC article.
-
AudioSense: Enabling Real-time Evaluation of Hearing Aid Technology In-Situ.Proc IEEE Int Symp Comput Based Med Syst. 2013;2013:167-172. doi: 10.1109/CBMS.2013.6627783. Proc IEEE Int Symp Comput Based Med Syst. 2013. PMID: 25013874 Free PMC article.
-
Personal Characteristics Associated with Ecological Momentary Assessment Compliance in Adult Cochlear Implant Candidates and Users.J Am Acad Audiol. 2022 Mar;33(3):158-169. doi: 10.1055/a-1674-0060. Epub 2021 Oct 20. J Am Acad Audiol. 2022. PMID: 34670290 Free PMC article.
References
-
- Axelsson A, Ringdahl A. Tinnitus: A study of its prevalence and characteristics. British Journal of Audiology. 1989;23:53–62. - PubMed
-
- Beal DJ, Weiss HM. Methods of ecological momentary assessment in organizational research. Organizational Research Methods. 2003;6(4):440–464.
-
- Boothroyd A, Fitz K, Kindred J, Kochkin S, Levitt H, Moore B, et al. Hearing aids and wireless technology. Hearing Review. 2007;14(6):44–47.
-
- Cruise CE, Broderick J, Porter L, Kaell A, Stone AA. Reactive effects of diary self-assessment in chronic pain patients. Pain. 1996;67(2–3):253–258. - PubMed
-
- Davis A, Refaie AE. Epidemiology of tinnitus. In: Tyler R, editor. Tinnitus Handbook. San Diego: Singular Publishing Group; 2000. pp. 1–23.
Publication types
MeSH terms
Grants and funding
LinkOut - more resources
Full Text Sources
Medical
Research Materials

