. 2012 Jan;22(1):142-50.
doi: 10.1101/gr.124107.111. Epub 2011 Sep 29.

Accurate identification of A-to-I RNA editing in human by transcriptome sequencing

Affiliations

Accurate identification of A-to-I RNA editing in human by transcriptome sequencing

Jae Hoon Bahn et al. Genome Res. 2012 Jan.

Abstract

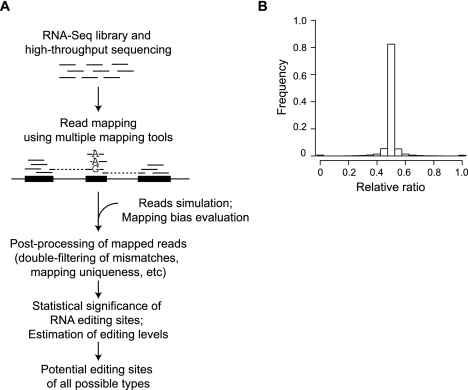
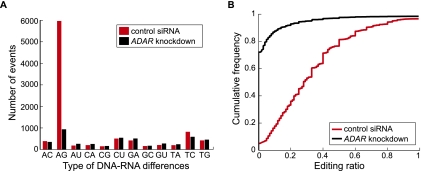
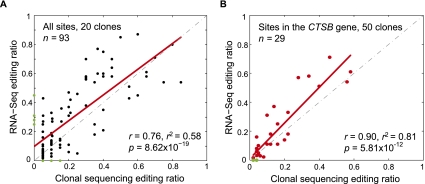
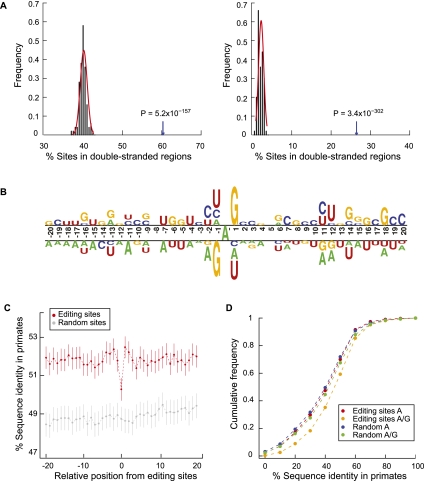
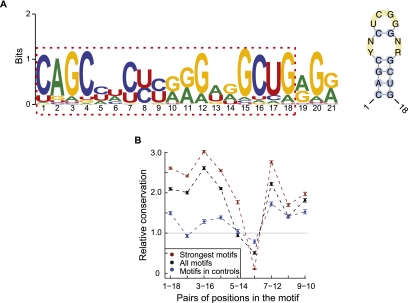
RNA editing enhances the diversity of gene products at the post-transcriptional level. Approaches for genome-wide identification of RNA editing face two main challenges: separating true editing sites from false discoveries and accurate estimation of editing levels. We developed an approach to analyze transcriptome sequencing data (RNA-seq) for global identification of RNA editing in cells for which whole-genome sequencing data are available. We applied the method to analyze RNA-seq data of a human glioblastoma cell line, U87MG. Around 10,000 DNA-RNA differences were identified, the majority being putative A-to-I editing sites. These predicted A-to-I events were associated with a low false-discovery rate (∼5%). Moreover, the estimated editing levels from RNA-seq correlated well with those based on traditional clonal sequencing. Our results further facilitated unbiased characterization of the sequence and evolutionary features flanking predicted A-to-I editing sites and discovery of a conserved RNA structural motif that may be functionally relevant to editing. Genes with predicted A-to-I editing were significantly enriched with those known to be involved in cancer, supporting the potential importance of cancer-specific RNA editing. A similar profile of DNA-RNA differences as in U87MG was predicted for another RNA-seq data set obtained from primary breast cancer samples. Remarkably, significant overlap exists between the putative editing sites of the two transcriptomes despite their difference in cell type, cancer type, and genomic backgrounds. Our approach enabled de novo identification of the RNA editome, which sets the stage for further mechanistic studies of this important step of post-transcriptional regulation.


Figures

Figure 1.
Figure 1.
Identification of RNA editing sites. (A) Generative process of the pipeline. (B) Evaluation of mapping bias using simulated data. Histogram shows the distribution of relative ratios of all simulated genomic sites with alternative alleles. Relative ratio is defined as follows: (N_mapped_ref/N_simulated_ref)/(N_mapped_ref/N_simulated_ref + N_mapped_edit/N_simulated_edit), where N_mapped_ref is the number of reads mapped to the reference base (e.g., A for A-to-I editing) and N_mapped_edit is the number of reads mapped to the edited base. N_simulated_ref and N_simulated_edit are defined similarly, but for the originally simulated reads. The average of all relative ratios is 0.499 and median is 0.500, neither of which is significantly different from the expected ratio 0.5 (P = 0.1, P = 0.3, respectively).
Figure 2.
Figure 2.
DNA–RNA differences identified via RNA-seq. (A) Number of events for the 12 types of differences between RNA reads and genomic DNA sequences in samples transfected with control siRNA and ADAR siRNA, respectively. Labels of x-axis denote DNA and RNA nucleotides (e.g.: “AC” denotes “A” in DNA and “C” in RNA). (B) Empirical cumulative distribution function of editing ratios of putative A-to-I editing events identified from RNA-seq. A union of editing events identified in the two samples is included (6422 in total) in each curve. For nonediting events in one sample (those that failed the statistical identification procedure), the editing ratio was calculated as the number of reads with the “G” nucleotide at the predicted editing position divided by the total number of reads at that position.
Figure 3.
Figure 3.
Validation of predicted A-to-I editing events identified via RNA-seq. (A) Scatterplot of editing ratios for the full set of 93 A-to-I editing events identified by RNA-seq and the traditional clonal sequencing method (20 clones were picked for each editing site). Pearson correlation coefficient is shown. Data points corresponding to false-positive or false-negative predictions are shown as green dots. (B) Same as A, but for the 29 editing events in the CTSB gene (read coverage, 35–69 reads per site). A total of 50 clones were picked for each site.
Figure 4.
Figure 4.
Sequence features of predicted A-to-I editing sites and the flanking regions. (A) Double-stranded regions in the neighborhoods of predicted A-to-I editing sites. (Left) Editing sites and controls are located in Alu elements. Controls were picked as random As in such regions with matched G+C content relative to the test regions (Supplemental Methods). Percentage of editing sites in double-stranded regions shown by arrow; percentage of control sites in double-stranded regions shown by black histogram. P-value was calculated by fitting a normal distribution to the control histogram. (Right) Same as the left panel, but editing sites and controls are outside of Alu elements. (B) Sequence preferences for base positions flanking predicted A-to-I editing sites. Editing sites (the A nucleotide at position 0) are aligned together. Sequence preference is represented using a two-sample logo program (Vacic et al. 2006). (C) Conservation of the immediate neighborhood of predicted A-to-I editing sites. Sequence conservation (percentage of identity) of each position flanking editing sites was calculated using the UCSC multiz46way alignments of primate genomes (Supplemental Methods). Random controls were picked for each editing site in the same type of regions (e.g., Alus in coding exons, Alus in introns). Vertical lines represent 95% confidence intervals. (D) Sequence conservation among primates at the edited sites before and after editing. Cumulative distribution functions are shown for percentage of identity at the editing sites assuming the nucleotide being A and (A or G) in human, respectively. Random controls were picked similarly as described in C.
Figure 5.
Figure 5.
A novel motif with potential function in A-to-I editing. (A) Consensus motif (left) identified by MEME in the 201-nt neighborhood centered around each predicted A-to-I editing sites. (Right) Structure of the one to 18 bases of the consensus motif (RNAalifold). Y = U or C, R = G or A, N = A, C, G or U. (B) Conservation of the base-pairing patterns of the motif in primates based on multiz46way alignments. Strong motifs, motif score >24.4; all motifs, motif score >6.6; controls (motif score >6.6) were randomly picked from Alu elements in coding exons devoid of A-to-I editing sites. Error bars represent 95% confidence intervals. The conservation levels were normalized against expected levels calculated using random controls (Supplemental Methods).

References

    1. Abbas AI, Urban DJ, Jensen NH, Farrell MS, Kroeze WK, Mieczkowski P, Wang Z, Roth BL 2010. Assessing serotonin receptor mRNA editing frequency by a novel ultra high-throughput sequencing method. Nucleic Acids Res 38: e118 doi: 10.1093/nar/gkq107 - PMC - PubMed
    1. Athanasiadis A, Rich A, Maas S 2004. Widespread A-to-I RNA editing of Alu-containing mRNAs in the human transcriptome. PLoS Biol 2: e391 doi: 10.1371/journal.pbio.0020391 - PMC - PubMed
    1. Bailey TL, Elkan C 1994. Fitting a mixture model by expectation maximization to discover motifs in biopolymers. Proc Int Conf Intell Syst Mol Biol 2: 28–36 - PubMed
    1. Bass BL 2002. RNA editing by adenosine deaminases that act on RNA. Annu Rev Biochem 71: 817–846 - PMC - PubMed
    1. Borchert GM, Gilmore BL, Spengler RM, Xing Y, Lanier W, Bhattacharya D, Davidson BL 2009. Adenosine deamination in human transcripts generates novel microRNA binding sites. Hum Mol Genet 18: 4801–4807 - PMC - PubMed

Publication types