Review
. 2011 Sep 30;109(8):941-61.
doi: 10.1161/CIRCRESAHA.111.243154.

Role of cardiac stem cells in cardiac pathophysiology: a paradigm shift in human myocardial biology

Affiliations
Review

Role of cardiac stem cells in cardiac pathophysiology: a paradigm shift in human myocardial biology

Annarosa Leri et al. Circ Res. .

Retraction in

Expression of concern in

  • Expression of Concern.
    [No authors listed] [No authors listed] Circ Res. 2019 Jan 18;124(2):e4-e5. doi: 10.1161/RES.0000000000000241. Circ Res. 2019. PMID: 30582460 No abstract available.
  • Expression of Concern.
    [No authors listed] [No authors listed] Circulation. 2019 Jan 15;139(3):e5-e6. doi: 10.1161/CIR.0000000000000639. Circulation. 2019. PMID: 30615475 No abstract available.

Abstract

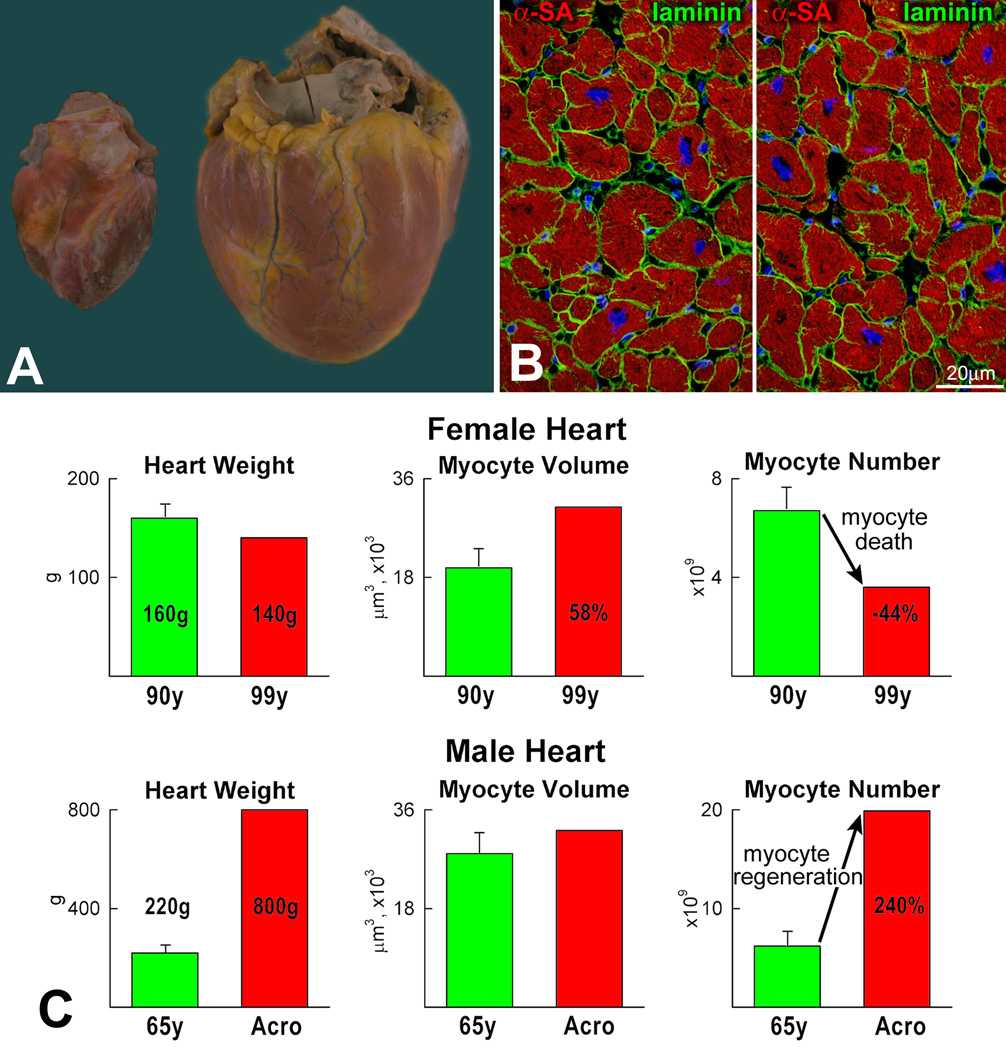
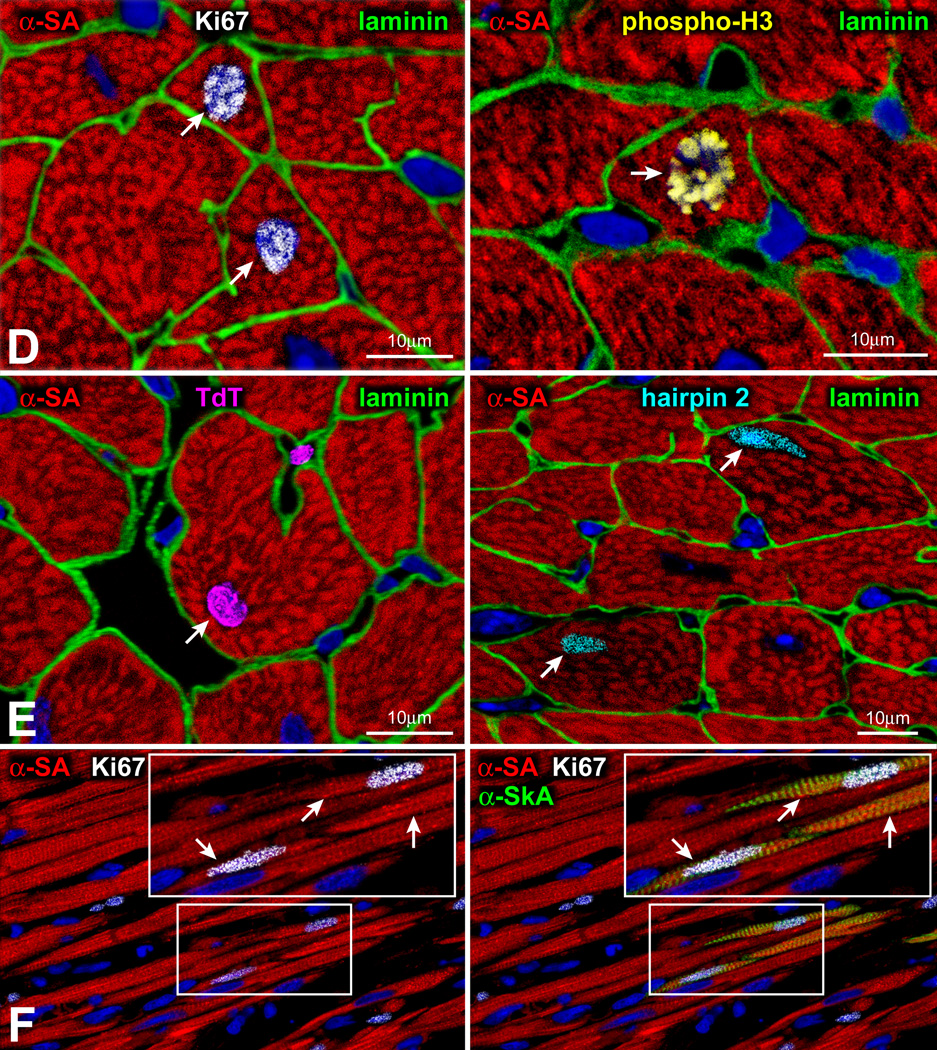
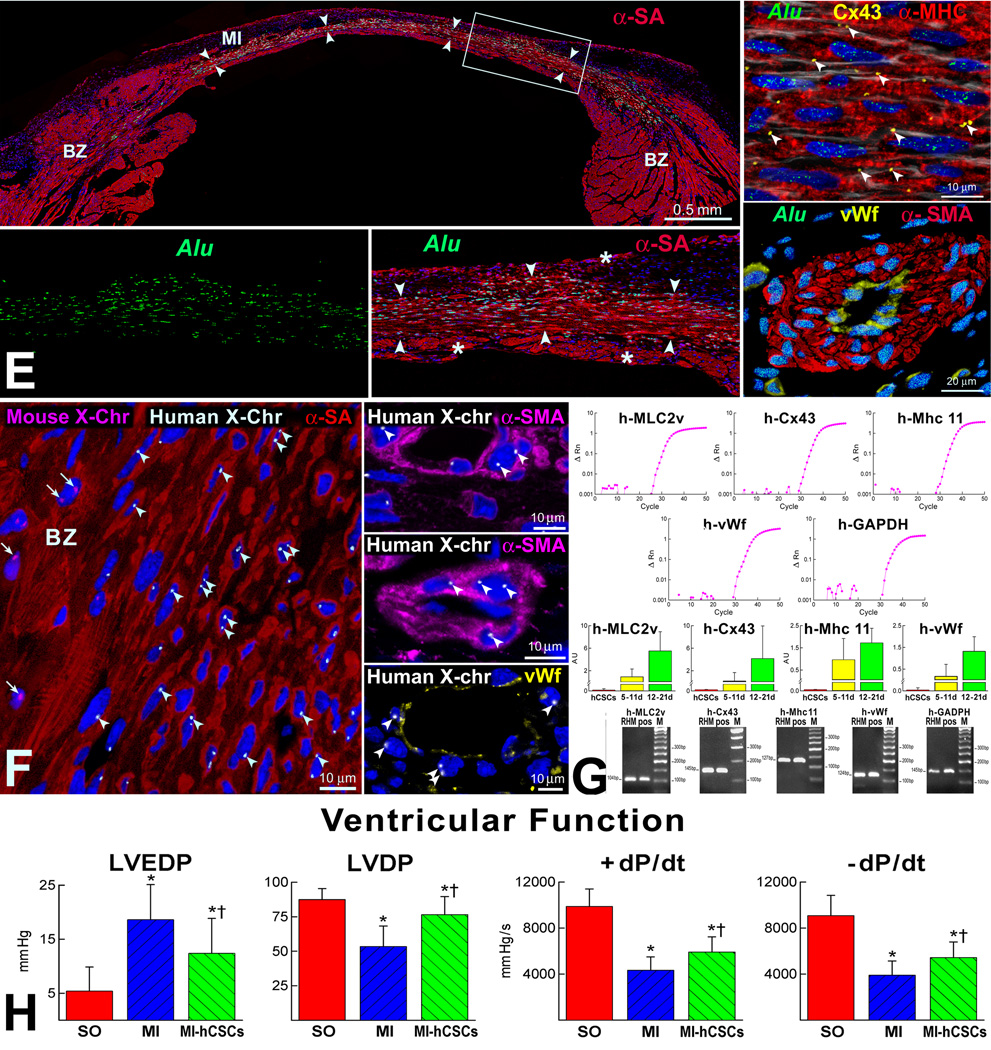
For nearly a century, the human heart has been viewed as a terminally differentiated postmitotic organ in which the number of cardiomyocytes is established at birth, and these cells persist throughout the lifespan of the organ and organism. However, the discovery that cardiac stem cells live in the heart and differentiate into the various cardiac cell lineages has changed profoundly our understanding of myocardial biology. Cardiac stem cells regulate myocyte turnover and condition myocardial recovery after injury. This novel information imposes a reconsideration of the mechanisms involved in myocardial aging and the progression of cardiac hypertrophy to heart failure. Similarly, the processes implicated in the adaptation of the infarcted heart have to be dissected in terms of the critical role that cardiac stem cells and myocyte regeneration play in the restoration of myocardial mass and ventricular function. Several categories of cardiac progenitors have been described but, thus far, the c-kit-positive cell is the only class of resident cells with the biological and functional properties of tissue specific adult stem cells.


Figures

Figure 1
Figure 1. Myocyte growth and death in the human heart
A, Female senescent heart (left) and male acromegalic heart (right). B, Myocyte size (α-sarcomeric actin, α-SA, red) is similar in the female senescent heart (left) and male acromegalic heart (right). Laminin (green) defines myocyte profiles. C, Average cardiac weight and myocyte volume and number are compared with values in the female senescent and male acromegalic heart. D, Small cycling myocytes express Ki67 (left: white, arrows); a small dividing myocyte is positive for phospho-H3 (right: yellow, arrow). E, Myocyte apoptosis (left: TdT, magenta, arrow) and necrosis (right: hairpin 2, bright blue, arrows). F, Small cycling Ki67 positive-myocytes express α-skeletal actin (α-SkA, green). The localization of α-SkA in Ki67-positive myocytes is shown at higher magnification in the insets.
Figure 2
Figure 2. Cellular basis of ventricular remodeling
A, Structural determinants of wall thickness and chamber diameter. B, Sudden increases in diastolic stress (P) affect the architectural integrity of myocyte bundles by triggering apoptotic cell death (thunderbolt; brown cells) which allows the redistribution of myocyte layers within the wall, i.e., side-to-side slippage of cells. This event decreases the number of myocytes across the wall resulting in wall thinning and cavitary dilation as shown in a simplified form in cross and longitudinal orientation of cells. C, Anatomical and cellular changes, together with tissue damage and collagen accumulation, characterize the evolution of pressure overload hypertrophy to cardiac failure. D, The pattern of sarcomere growth conditions ncrease in myocyte length and diameter. E, New myocytes can be added in series (chamber dilation), or in parallel (wall thickening), or both (chamber dilation and wall thickening).
Figure 3
Figure 3. Cardiomyocyte growth and death
A, Replicating human cardiomyocytes (α-SA, red) express CDC6 (bright blue, arrow), Ki67 (white, arrows), MCM5 (magenta, arrows), phospho-H3 (yellow), and aurora B kinase (bright blue). Myocytes in mitosis are shown at higher magnification in the insets. B, Apoptotic human myocyte detected by TdT labeling (yellow, arrow). C, Necrotic human myocyte recognized by rupture of the plasma membrane shown by vinculin staining (bright blue, arrows). D, Plasma levels of troponin T indicative of myocyte necrosis in the human heart. E, Two-photon microscopy of a heart 30 days after coronary ligation and implantation of HSCs obtained from a mouse in which EGFP was under the control of the α-myosin heavy chain promoter. The green portion of the ventricle corresponds to myocytes derived from the implanted HSCs and the red region corresponds to the recipient mouse myocardium. Ca2+ transient was detected by line scan in EGFP-positive and EGFP-negative myocytes. Ca2+ traces were synchronous in EGFP-positive (green traces) and EGFP-negative (red traces) myocytes. F, EGFP-positive myocytes were excitable and had higher shortening than spared hypertrophied myocytes (see bar graph). Individual, isolated myocytes formed by HSC transdifferentiation are shown in the lower panel. Cell volume, µm3.
Figure 4
Figure 4. CSCs and myocardial regeneration
A, CSC niches in the human heart. CSCs are c-kit-positive (green) and are connected by connexin 43 (Cx43, yellow, arrows) and N-cadherin (N-cadh, bright blue, arrows) to myocytes (α-SA, red) and fibroblasts (procollagen, procoll, magenta). Fibronectin, white. B, Delivery of rat CSCs to acutely infarcted syngeneic animals results in partial restoration of the necrotic myocardium (myosin heavy chain, MHC, red; arrowheads). The area included in the rectangle is shown at higher magnification in the adjacent panel. Asterisks indicate surviving myocardium. C and D, Regenerated BrdU-positive (green) mononucleated and binucleated cardiomyocytes (MHC, red) were isolated (C) and sarcomere mechanics (D) was assesses in new and spared myocytes. E, A similar regenerative response was found following the injection of EGFP-positive CSCs in chronically infarcted hearts. Cell shortening was increased in the small CSC-derived EGFP-positive cardiomyocytes.
Figure 5
Figure 5. In vivo tracking of CSC fate
A, Schematic representation of stem cell lineage tracing. Cardiomyocytes, SMCs and ECs can be formed by commitment of one, two, or three stem cells carrying the reporter gene. The self-renewal of individual stem cells sharing the fluorescent label cannot be determined by this molecular-genetic approach. B, The delivery of non-clonal, i.e., not single cell-derived CSCs, has the same limitations of in vivo cell fate mapping. C, Multicellular clones derived from the proliferation of single founder hCSC (c-kit, green). D, Mitotic hCSCs (c-kit, green) show uniform (left) and non-uniform (right) distribution of α-adaptin (blue), documenting symmetric and asymmetric division, respectively. Daughter cells of the asymmetrically dividing hCSCs show Nkx2.5 (right: white, asterisk). Chromosomes are organized in telophase (propidium iodide, PI: red). Upper panels correspond to cultured hCSCs. Lower panels reflect a cluster of c-kit-positive hCSCs two days after delivery in the border zone of an infarct. E, Myocardial regeneration in a rodent heart 21 days after infarction and injection of hCSCs. Human myocardium (arrowheads) is present within the infarct (MI). BZ, border zone. The area in the rectangle is shown at higher magnification in the lower panels. Human myocytes are Alu- (green) and α-SA- (red) positive. Asterisks indicate spared myocytes. Regenerated myocytes express Cx43 (yellow, arrowheads) and show sarcomere striation (upper right). A regenerated coronary arteriole (lower right) contains SMCs (α-smooth muscle actin, α-SMA, red) and ECs (von Willebrand factor, vWf, yellow) which are Alu-positive (green). F, Human myocytes and vessels show, at most, two human X-chromosomes (X-Chr, white dots; arrowheads). Mouse X-Chr (magenta dots; arrows) are present in myocytes of BZ. G, Expression of human (h) genes by qRT-PCR in treated infarcted rats at 5–11 and 12–21 days. Representative tracings of transcripts for human myosin light heavy chain 2v (h-MLC2v), human Cx43 (h-Cx43), human myosin heavy chain 11 (h-Mhc 11), human vWf (h-vWf) and the housekeeping gene human GAPDH (h-GAPDH) are shown. Clonal hCSCs were used for comparison of human transcripts. PCR products had the expected molecular weight. H, Ventricular function in sham-operated (SO), infarcted (MI) and infarcted-treated (Mi-hCSCs) mice. *, P<0.05, versus SO and MI, respectively.
Figure 6
Figure 6. Clonal marking of mouse and human CSCs in vivo
A, A lentiviral vector carrying EGFP was injected in proximity of the atrial and apical niches in mice at 3 months of age. Four months later, EGFP-positive CSCs, ECs, fibroblasts and myocytes were sorted by FACS and the site of proviral integration was determined by PCR. In this example, four distinct clones were identified in CSCs, ECs, fibroblasts (Fbl), and myocytes (Myo) isolated from one mouse heart. Bands of the same molecular weight correspond to identical sites of integration of the viral sequence in the host genome. B, A similar approach was applied to the analysis of myocardial regeneration following injection of hCSCs. Various clones were detected in distinct cardiac cell populations from the regenerated myocardium of one treated rat. The sites of integration in isolated cell populations are listed. Some clones were common to different cell classes (same color arrowheads).
Figure 7
Figure 7. Cardiac stem/progenitor cell classes
Schematic representation of populations of cardiac-derived stem/progenitor cells (see text for detail).
Figure 8
Figure 8. Myocyte turnover
A, In the absence of cell proliferation, the fraction of original myocytes remaining in the human left ventricle would decrease dramatically with age. B, Section of human myocardium in which troponin I (TnI) in myocyte nuclei (left: red, arrows) co-localizes with p16INK4a (center: bright blue, arrows); nuclei are stained by DAPI (white). Right, merge. C, Bivariate distribution of TnI and p16INK4a in pure preparations of myocyte nuclei. Q1, Nuclei negative for TnI and p16INK4a; Q2, Nuclei positive for p16INK4a only; Q3, Nuclei positive for TnI only; Q4, Nuclei positive for TnI and p16INK4a. D, Myocyte nuclei (DAPI, blue) exclude FITC-500 kDa dextran (negative control, green). TRITC-70 kDa dextran (red) diffuses into a fraction of myocyte nuclei (arrows) that is larger in nuclei from senescent hearts. m, months. E, Nup93 expression in myocyte nuclei. Loading conditions, lamin B1. OD, optical density. *P<0.05. F, Example of erroneous interpretation of 14C birth dating of myocytes (see ref. 28); this is apparent in 3 cases (red, green and blue symbols) in which the average age of all cardiac cells (upper left) was compared with the age of myocytes (upper right). Since the proportion of myocytes in the preparation is known for each individual, it was possible to calculate that the required 14C levels in non-myocytes were present in the atmosphere only before these individuals were born (lower left). The date of birth of each patient is shown by a vertical line. An extreme case is illustrated separately in the lower right panel; here the level of 14C in non-myocytes is so low that these cells had to be born 1000 AD, with further loss of the isotope through radioactive decay over the years. G, Rate of myocyte turnover in the female and male heart increases with age. H, In the acutely infarcted human heart, c-kit positive hCSCs (green) within the infarct die by apoptosis (upper: white nuclear dots, arrows) and necrosis (lower: yellow nuclear dots, arrows). Note that surrounding myocytes are also dying. I, Senescent stem cell niche: c-kit-positive hCSCs (green) express p16INK4a (magenta).

Comment in

  • Cardiomyocyte renewal in humans.
    Bergmann O, Zdunek S, Frisén J, Bernard S, Druid H, Jovinge S. Bergmann O, et al. Circ Res. 2012 Jan 6;110(1):e17-8; author reply e19-21. doi: 10.1161/CIRCRESAHA.111.259598. Circ Res. 2012. PMID: 22223215 No abstract available.

References

    1. Anversa P, Olivetti G. The Heart. New York: Oxford University Press; 2002. Cellular basis of physiological and pathological myocardial growth. Handbook of physiology: the cardiovascular system; pp. 75–144.
    1. Hill JA, Olson EN. Mechanisms of disease cardiac plasticity. N Engl J Med. 2008;358:1370–1380. - PubMed
    1. Heineke J, Molkentin JD. Regulation of cardiac hypertrophy by intracellular signaling pathways. Nat Rev Mol Cell Biol. 2006;7:589–600. - PubMed
    1. Houser SR, Molkentin JD. Does contractile Ca2+ control calcineurin-NFAT signaling and pathological hypertrophy in cardiac myocytes? Sci Signal. 2008;1:pe31. - PMC - PubMed
    1. Hill JA. Electrical remodeling in cardiac hypertrophy. Trends Cardiovasc Med. 2003;13:316–322. - PubMed

Publication types