. 2011:2011:706746.
doi: 10.1155/2011/706746. Epub 2011 Sep 22.

Proteomic analysis of sera from common variable immunodeficiency patients undergoing replacement intravenous immunoglobulin therapy

Affiliations

Proteomic analysis of sera from common variable immunodeficiency patients undergoing replacement intravenous immunoglobulin therapy

Giuseppe Spadaro et al. J Biomed Biotechnol. 2011.

Abstract

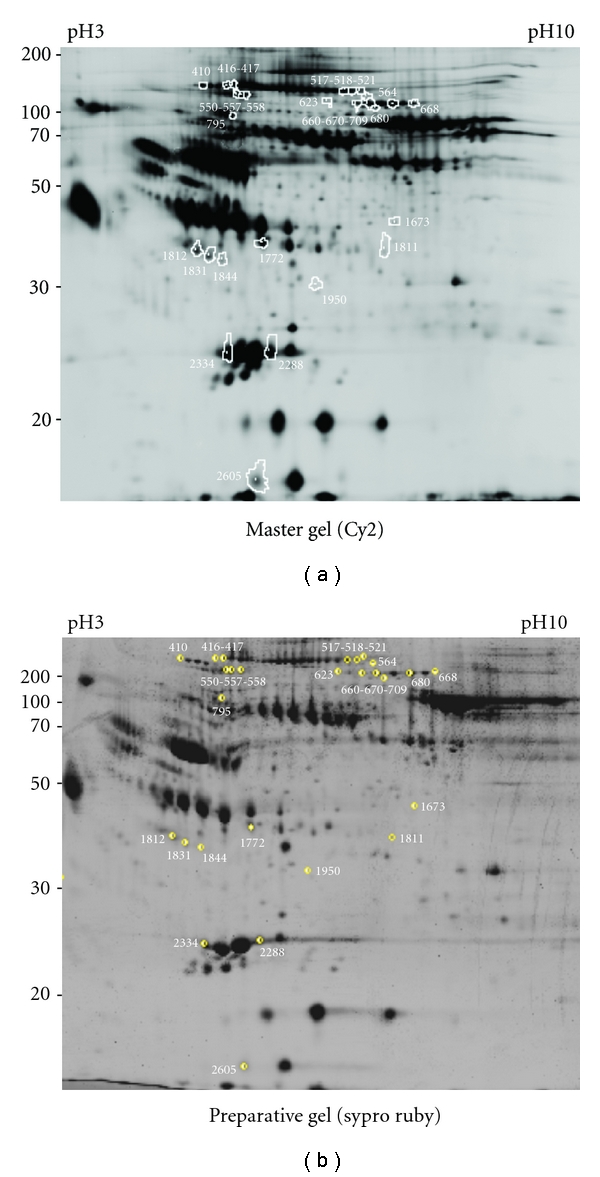
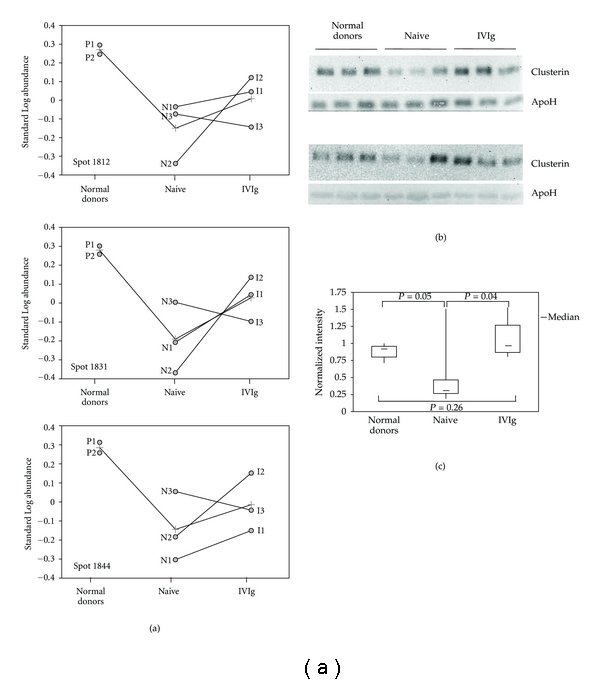
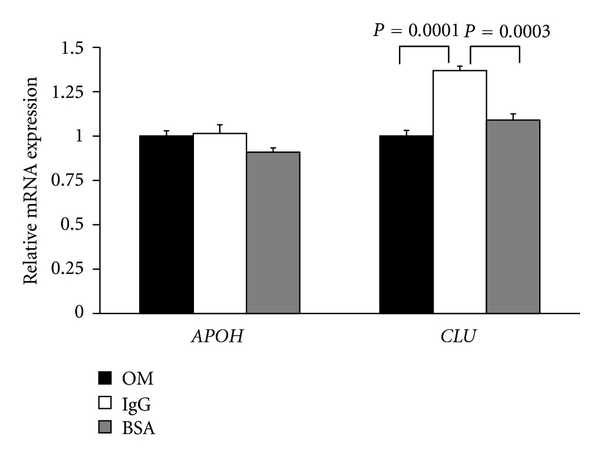
Common variable immunodeficiency is the most common form of symptomatic primary antibody failure in adults and children. Replacement immunoglobulin is the standard treatment of these patients. By using a differential proteomic approach based on 2D-DIGE, we examined serum samples from normal donors and from matched, naive, and immunoglobulin-treated patients. The results highlighted regulated expression of serum proteins in naive patients. Among the identified proteins, clusterin/ApoJ serum levels were lower in naive patients, compared to normal subjects. This finding was validated in a wider collection of samples from newly enrolled patients. The establishment of a cellular system, based on a human hepatocyte cell line HuH7, allowed to ascertain a potential role in the regulation of CLU gene expression by immunoglobulins.


Figures

Figure 1
Figure 1
2-DE map of differentially expressed proteins in CVID. The figure shows the position on the master (a) and on the preparative (b) gels of the 27 deregulated spots, as revealed by the comparison of serum samples from normal and CVID patients. In (a), the spots are surrounded by a white border; matched spots within the preparative gel (b) are highlighted by a yellow circle, also indicating the picking surface for the robotic spot picker. The representative image reported in (a) shows to the Cy2-labelled proteins on the scanned master gel; protein spots in (b) were visualized by Sypro Ruby fluorescent staining.
Figure 2
Figure 2
Clusterin expression in CVID. (a) The panel shows the graphic output of DeCyder software (BVA module) for spots 1812, 1831 and 1844, further identified as clusterin. The line connecting normal donors (pools P1 and P2), naive patients (N1–N3), and IVIg-treated patients (T1–T3) in each of the panels represents average levels of the corresponding protein spot. The lines connecting naive samples to the corresponding IVIg-treated samples denote the change in protein expression after one-year substitutive therapy for each of the three patients. (b) Western blot analysis of clusterin in serum samples from normal donors, naive, and IVIg-treated patients. The experiment was performed on individual serum samples from normal donors and newly enrolled, naive and IVIg-treated patients. Each gel was loaded with serum samples from three healthy controls, three naive patients, and three IVIg-treated individuals for >5 years. The filters were first incubated with clusterin antibodies, then with an apolipoprotein H antibody for individual normalization of protein contents. (c) The normal serum with highest normalized expression of clusterin was set to 1, for relative analysis of normalized clusterin expression in the samples loaded on the western blot of Figure 2(b). The data were then used to build the shown box plot. The bottom and top of each box represent the 25th and 75th percentile, respectively; the thick band inside each box shows the 50th percentile (the median). The ends of the whiskers represent the minimum and maximum values of each group of data. The brackets indicate the statistical comparisons between groups with the corresponding P values.
Figure 3
Figure 3
Real-time PCR analysis of clusterin transcript expression in HuH7 cells treated with immunoglobulins. The chart shows the expression of apolipoprotein H (APOH) or clusterin (CLU) transcripts in HuH7 cells adapted to culture in Opti-MEM (OM: black bars), or treated with immunoglobulins (Ig: white bars) or bovine serum albumin (BSA: gray bars). The bars indicate the average expression levels and the observed standard deviations. The expression levels of CLU or APOH transcripts were normalized to β-actin mRNA levels.

Similar articles

Cited by

References

    1. Rosen FS, Eibl M, Roifman C, et al. Primary immunodeficiency diseases. Clinical and Experimental Immunology, Supplement. 1999;118(1):1–28.
    1. Cunningham-Rundles C, Bodian C. Common variable immunodeficiency: clinical and immunological features of 248 patients. Clinical Immunology. 1999;92(1):34–48. - PubMed
    1. Park MA, Li JT, Hagan JB, Maddox DE, Abraham RS. Common variable immunodeficiency: a new look at an old disease. The Lancet. 2008;372(9637):489–502. - PubMed
    1. Deane S, Selmi C, Naguwa SM, Teuber SS, Gershwin ME. Common variable immunodeficiency: etiological and treatment issues. International Archives of Allergy and Immunology. 2009;150(4):311–324. - PMC - PubMed
    1. Ardeniz O, Başoğlu OK, Günşar F, et al. Clinical and immunological analysis of 23 adult patients with common variable immunodeficiency. Journal of Investigational Allergology and Clinical Immunology. 2010;20(3):222–236. - PubMed

Publication types