. 2011;6(9):e24508.
doi: 10.1371/journal.pone.0024508. Epub 2011 Sep 22.

Complexity of bidirectional transcription and alternative splicing at human RCAN3 locus

Affiliations

Complexity of bidirectional transcription and alternative splicing at human RCAN3 locus

Federica Facchin et al. PLoS One. 2011.

Abstract

Human RCAN3 (regulator of calcineurin 3) belongs to the human RCAN gene family.In this study we provide, with in silico and in vitro analyses, the first detailed description of the human multi-transcript RCAN3 locus. Its analysis revealed that it is composed of a multigene system that includes at least 21 RCAN3 alternative spliced isoforms (16 of them identified here for the first time) and a new RCAN3 antisense gene (RCAN3AS). In particular, we cloned RCAN3-1,3,4,5 (lacking exon 2), RCAN3-1a,2,3,4,5, RCAN3-1a,3,4,5, RCAN3-1b,2,3,4,5, RCAN3-1c,2,3,4,5, RCAN3-1c,2,4,5 and RCAN3-1c,3,4,5, isoforms that present a different 5' untranslated region when compared to RCAN3. Moreover, in order to verify the possible 5' incompleteness of previously identified cDNA isoforms with the reference exon 1, ten more alternative isoforms were retrieved. Bioinformatic searches allowed us to identify RCAN3AS, which overlaps in part with exon 1a, on the opposite strand, for which four different RCAN3AS isoforms were cloned.In order to analyze the different expression patterns of RCAN3 alternative first exons and of RCAN3AS mRNA isoforms, RT-PCR was performed in 17 human tissues. Finally, analyses of RCAN3 and RCAN3AS genomic sequences were performed to identify possible promoter regions, to examine donor and acceptor splice sequences and to compare evolutionary conservation, in particular of alternative exon 1 or 1c--exon 2 junctions in different species.The description of its number of transcripts, of their expression patterns and of their regulatory regions can be important to clarify the functions of RCAN3 gene in different pathways and cellular processes.


Conflict of interest statement

Competing Interests: The authors have declared that no competing interests exist.

Figures

Figure 1
Figure 1. Schematic representation of RCAN3 gene locus: RCAN3 and RCAN3AS isoforms exon-intron organization.
In the DNA scheme, intron sizes (represented not in scale) in base pair (bp) are indicated between the two exons; exon sizes are represented in scale, except for exon -1 (that overlaps with exon 1a on the opposite strand) and exon 1c (that lacks the last 33 bp of exon 1). Exons 1, 2 and 3 are located on the opposite strand. Exons 1 and 5 may not appear in full length in the mRNA diagram due to incompleteness of sequence determination in 5′ or 3′. The diagram, representing mRNAs, shows the longest sequences available to date (see GenBank accession numbers in the figure). In the sense transcripts the direction of translation is to the right and in the antisense transcripts it is to the left. “formula image formula image
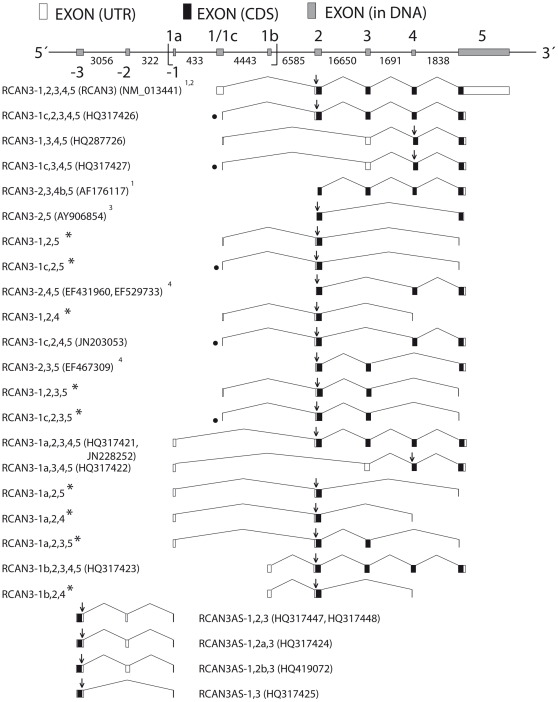
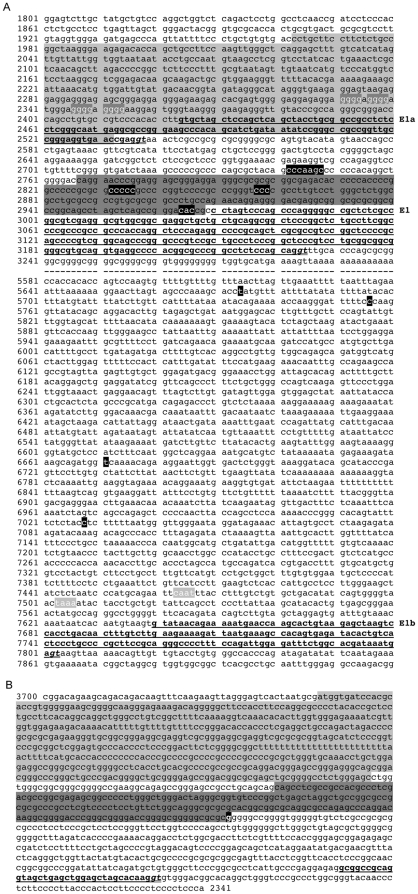
” indicates the DNA region comprised between 24,828,218 and 24,834,337 nucleotides of the chromosome 1 reference sequence NC_000001: it corresponds to the sequence showed in Figure 5A (see Figure 5A legend). 1 described in Strippoli et al., 2000, 2 described in Strausberg et al., 2002, 3 described in Canaider et al., 2006 and 4 described in Facchin et al., 2008. “*” indicates transcripts for which it was not possible to deposit a relative GenBank file. “•” indicates transcripts with exon 1c. “↓” indicates the start codon.
Figure 2
Figure 2. RCAN3-1a,2,3,4,5 and RCAN3-1b,2,3,4,5 cDNAs (example gel).
A) 1% agarose gel loaded with human prostate tissue RT-PCR products. Lanes 1 and 2: RCAN3-1a,2,3,4,5 (expected band size: 1,001 bp). The lowest band referred to the RCAN3-1a,3,4,5 isoform (band size: 747 bp). M: size marker GeneRuler (500 ng). B) 1% agarose gel loaded with human lung tissue RT-PCR products. Lanes 1 and 2: RCAN3-1b,2,3,4,5 (expected band size: 1,050 bp); lane 3: beta 2 microglobulin (B2M, expected band size: 586 bp). M: size marker GeneRuler (500 ng). Other bands than the expected and not indicated are referred to RT-PCR artifacts or to RCAN3-1a,2,4, RCAN3-1a,2,5, RCAN3-1a,2,3,5 (Figure 2A) and RCAN3-1b,2,4 (Figure 2B) transcript assemblies whose existences were demonstrated by RT-PCRs performed with specific primers, as described in the text. C) 1% agarose gel loaded with human peripheral blood leucocytes RT-PCR products. Lane 1: RCAN3-1,2,3,5 (expected band size: 511 bp) and RCAN3-1c,2,3,5 (unexpected band size: 478 bp); lane 2: RCAN3-1,2,5 (expected band size: 342 bp) and RCAN3-1c,2,5 (unexpected band size: 309 bp); lane 3: RCAN3-1,2,4 (expected band size: 337 bp) and RCAN3-1c,2,4 (unexpected band size: 304 bp). M: size marker GeneRuler (500 ng).
Figure 3
Figure 3. Representative expression panel of RCAN3 exon 1 and exon 1c (example gel).
1% agarose gel loaded with human normal tissues RT-PCR products: exon 1 - exon 2 junction cDNA in A and exon 1c - exon 2 junction cDNA in B (expected band size: 166 bp and 137 bp, respectively). Lanes: 1, brain; 2, prostate; 3, peripheral blood leukocytes; 4, thymus; 5, spleen; 6, stomach; 7, colon; 8, bone marrow; 9, testis; 10, lung; 11, small intestine; 12, adrenal gland; 13, mammary gland; 14, liver; 15, pancreas; 16, heart; 17, skeletal muscle. M: size marker GeneRuler (500 ng), lane 18: B2M (expected band height: 586 bp) in peripheral blood leukocytes; lane 19: negative control.
Figure 4
Figure 4. RCAN3AS mRNA isoforms sequence identification and analysis.
A) 1% agarose gel loaded with RCAN3AS colony PCR products. From left to right: RCAN3AS-1,3 (expected band size: 547 bp), RCAN3AS-1,2a,3 (expected band size: 658 bp), RCAN3AS-1,2b,3 (expected band size: 699 bp) and RCAN3AS-1,2,3 (expected band size: 606 bp). M: size marker GeneRuler (500 ng). Band heights result by using specific pCR2.1 plasmid primer pairs. B) RCAN3AS mRNA isoform sequences aligned by ClustalW software. Exon 2a and exon 2b are longer than exon 2 in their 5′ (52 bp and 93 bp, respectively).
Figure 5
Figure 5. Promoter analysis in RCAN3 alternative first exons and RCAN3AS isoforms.
Highlighted in light grey: promoter region; highlighted in dark grey: CpG island; in bold and underlined: exon sequence; in bold, italic and double underlined: GT splice signal; in bold, white and highlighted in black: transcription start site (TSS). A) AL034582 genomic sequence from 1,801 to 7,920 nucleotides, corresponding to the chromosome 1 reference sequence NC_000001 from 24,828,218 to 24,834,337 nucleotides, respectively. The same genomic interval is indicated by two graphic symbols in the DNA scheme of Figure 1. In bold, white and highlighted in dark grey: guanine repetitions; in bold, white and highlighted in light grey: “CAAT box” and “TATA box”; - -: genomic interval. B) AL034582 reverse genomic sequence (1-1,360 bp corresponding to 3,700-2,341 bp of AL034582 direct sequence) with RCAN3AS exon 1 (bold and underlined).
Figure 6
Figure 6. RCAN3 isoform predicted protein sequences aligned by ClustalW software.
RCAN3-2,3,4,5 here refers to RCAN3-1,2,3,4,5, RCAN3-1a,2,3,4,5, RCAN3-1b,2,3,4,5 and RCAN3-1c,2,3,4,5 mRNA products. RCAN3-2,4,5 refers with certainty to RCAN3-1c,2,4,5 mRNA product. In all these isoforms the coding sequence starts in exon 2 and finishes in exon 5. RCAN3-4,5 refers to RCAN3-1,3,4,5, RCAN3-1a,3,4,5 and RCAN3-1c,3,4,5 product sequences. In all these isoforms the coding sequence starts in exon 4. Due to the lack of exon 2, RCAN3-4,5 sequence is shorter than RCAN3-1,2,3,4,5 protein and lacking the amino terminus containing the exon 2 product necessary for human cardiac troponin I (TNNI3) binding. Due to out-of-frame joining between exons 2 and 5 and between exons 3 and 5, the carboxyl terminus sequence encoded by RCAN3-2,5 and by RCAN3-2,3,5 cDNAs, respectively, is not similar to that of RCAN3-1,2,3,4,5 product sequence. In bold and italic the initial methionine of the proteins. Black border box: exon 2 encoded amino acids; shaded dark grey residues: FLISPP motif. Shaded light grey: CIC motif, with the embedded ELHA motif (KYELHAGTESTPS). The diagram shows the longest protein sequences available to date (see mRNA GenBank accession numbers in text or figure 1). Alignment was made by ClustalW software and manual adjustment.

Similar articles

Cited by

References

    1. Fuentes JJ, Pritchard MA, Planas AM, Bosch A, Ferrer I, et al. A new human gene from the Down syndrome critical region encodes a proline-rich protein highly expressed in fetal brain and heart. Hum Mol Genet. 1995;4:1935–1944. - PubMed
    1. Miyazaki T, Kanou Y, Murata Y, Ohmori S, Niwa T, et al. Molecular cloning of a novel thyroid hormone-responsive gene, ZAKI-4, in human skin fibroblasts. J Biol Chem. 1996;271:14567–14571. - PubMed
    1. Strippoli P, Lenzi L, Petrini M, Carinci P, Zannotti M. A new gene family including DSCR1 (Down Syndrome Candidate Region 1) and ZAKI-4: characterization from yeast to human and identification of DSCR1-like 2, a novel human member (DSCR1L2). Genomics. 2000;64:252–263. - PubMed
    1. Davies KJ, Ermak G, Rothermel BA, Pritchard M, Heitman J, et al. Renaming the DSCR1/Adapt78 gene family as RCAN: regulators of calcineurin. FASEB J. 2007;21:3023–3028. - PubMed
    1. Fuentes JJ, Genesca L, Kingsbury TJ, Cunningham KW, Perez-Riba M, et al. DSCR1, overexpressed in Down syndrome, is an inhibitor of calcineurin-mediated signaling pathways. Hum Mol Genet. 2000;9:1681–1690. - PubMed

Publication types

Substances

LinkOut - more resources