. 2011;6(9):e24807.
doi: 10.1371/journal.pone.0024807. Epub 2011 Sep 22.

Direct in vivo evidence for tumor propagation by glioblastoma cancer stem cells

Affiliations

Direct in vivo evidence for tumor propagation by glioblastoma cancer stem cells

Justin D Lathia et al. PLoS One. 2011.

Abstract

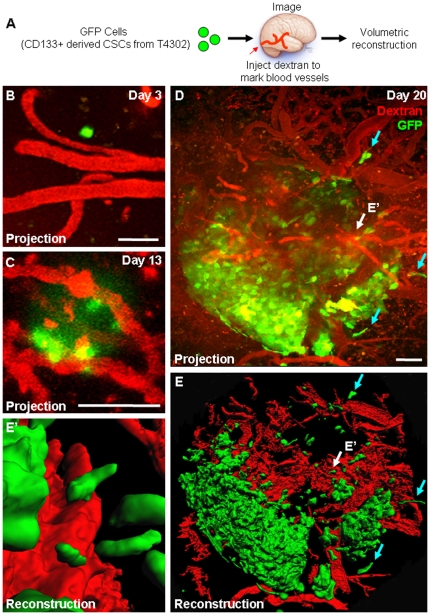
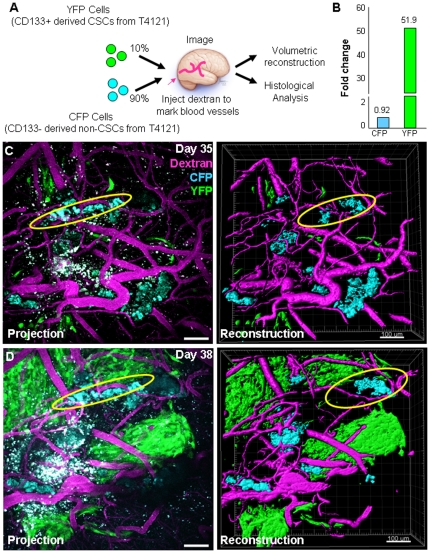
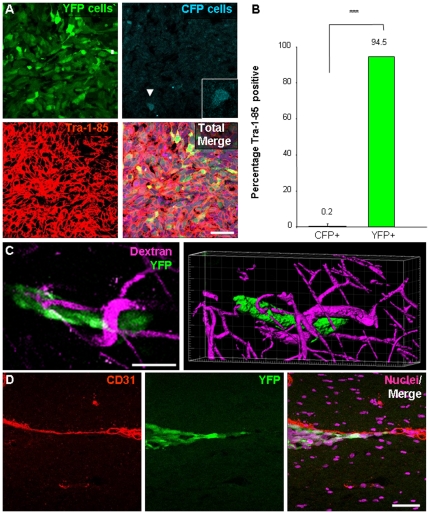
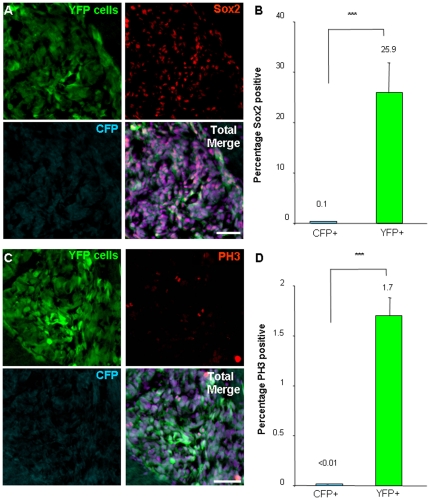
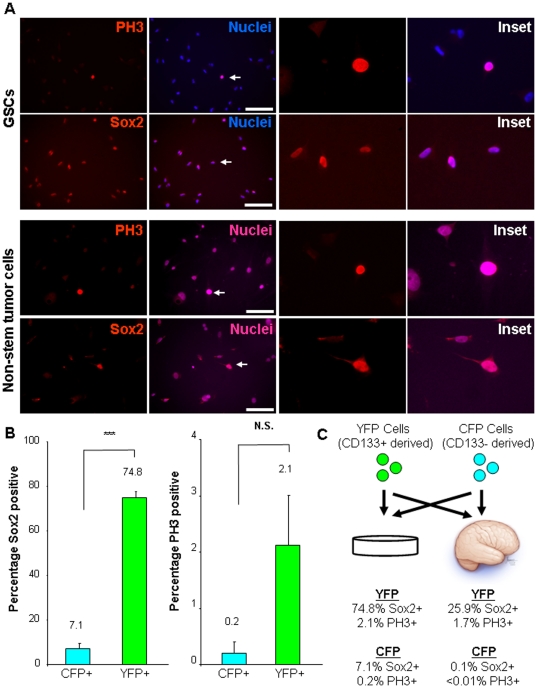
High-grade gliomas (World Health Organization grade III anaplastic astrocytoma and grade IV glioblastoma multiforme), the most prevalent primary malignant brain tumors, display a cellular hierarchy with self-renewing, tumorigenic cancer stem cells (CSCs) at the apex. While the CSC hypothesis has been an attractive model to describe many aspects of tumor behavior, it remains controversial due to unresolved issues including the use of ex vivo analyses with differential growth conditions. A CSC population has been confirmed in malignant gliomas by preferential tumor formation from cells directly isolated from patient biopsy specimens. However, direct comparison of multiple tumor cell populations with analysis of the resulting phenotypes of each population within a representative tumor environment has not been clearly described. To directly test the relative tumorigenic potential of CSCs and non-stem tumor cells in the same microenvironment, we interrogated matched tumor populations purified from a primary human tumor transplanted into a xenograft mouse model and monitored competitive in vivo tumor growth studies using serial in vivo intravital microscopy. While CSCs were a small minority of the initial transplanted cancer cell population, the CSCs, not the non-stem tumor cells, drove tumor formation and yielded tumors displaying a cellular hierarchy. In the resulting tumors, a fraction of the initial transplanted CSCs maintained expression of stem cell and proliferation markers, which were significantly higher compared to the non-stem tumor cell population and demonstrated that CSCs generated cellular heterogeneity within the tumor. These head-to-head comparisons between matched CSCs and non-stem tumor cells provide the first functional evidence using live imaging that in the same microenvironment, CSCs more than non-stem tumor cells are responsible for tumor propagation, confirming the functional definition of a CSC.


Conflict of interest statement

Competing Interests: The authors have declared that no competing interests exist.

Figures

Figure 1
Figure 1. Multiphoton microscopy reveals tumor propagation from cancer stem cells.
Tumor formation in a xenotransplantation model was observed from GFP-labeled CSCs over time as shown in experimental design schematic (A). Projection micrographs (B-D) demonstrate tumor formation over time and three-dimensional reconstructions depicted in micrographs (E, E’) revealed tumor cells were closely associated with blood vessels (E’, shown with white arrows in D, E) and in peripheral areas (D, E, shown in blue arrows). Fluorescent dextran (shown in red) was injected into the circulation to illuminate blood vessels prior to imaging. Scale bar represents 50 µm.
Figure 2
Figure 2. Multiphoton microscopy reveals cancer stem cell driven tumor propagation.
Fractionated CSCs and non-stem tumor cells were labeled with different fluorescent proteins and transplanted into mice at a 10% cancer stem cell (YFP) to 90% non-stem tumor cell (CFP) ratio as shown in experimental design schematic (A). CSCs outgrew non-CSCs in vivo as shown in summary graph (B), which was calculated based on three-dimensional reconstructions of projection micrographs (B, C). Additionally, tumor populations did not intermingle in vivo (non-stem tumor population indicated by yellow oval). Fluorescent dextran (shown in purple) was injected into the circulation to illuminate blood vessels prior to imaging. Scale bar represents 100 µm.
Figure 3
Figure 3. Histological evaluation reveals tumors contained cancer stem cells and their descendants that had association with blood vessels.
Tumors from the cell mixing experiments (n = 3) were evaluated to determine their composition. Subsequent evaluation of resulting tumors demonstrates that the majority of the cells within the tumor mass was of human origin and derived from CSC as confirmed by Tra-1-85 staining and YFP expression, shown in representative micrographs (A) and bar graph (B). Peripheral transplanted tumor cells (YFP positive CSCs and their descendants) were observed to have an association with blood vessels. Micrograph from multiphoton imaging and three-dimensional reconstruction (C) depict close association of tumor cells (green) with adjacent blood vessel (purple, illuminated by fluorescent dextran injection into the circulation prior to imaging). Histological examination of resulting tumors confirms close association of peripheral tumor cells to the vasculature using CD31 immunostaining (D; CD31 in red, tumor cells in green, nuclei in purple). Scale bar represents 50 µm. Data displayed as mean values +/- S.E.M. ***, p<0.001 as assessed by one-way analysis of variance (ANOVA).
Figure 4
Figure 4. Tumors contain fractions of stem-like and proliferating cells that originated from cancer stem cells.
Histological examination was performed from resulting tumors in the cell mixing experiments (n = 3) to determine the fraction of stem-like cells as assessed by Sox2 expression and the presence of proliferating cells as confirmed by the M-phase marker phosphorylated histone 3 (PH3). Representative micrographs (A) and bar graph (B) demonstrate Sox2 expression (red) is associated with cancer stem cells and their descendants (green) but not with non-stem tumor cells and their descendants (blue). Representative micrographs (C) and bar graph (D) demonstrate PH3 expression (red) is associated with cancer stem cells and their descendants (green) but not with non-stem tumor cells and their descendants (blue). Scale bar represents 50 µm. Data displayed as mean values +/− S.E.M. ***, p<0.001 as assessed by one-way analysis of variance (ANOVA), nuclei counterstained with Draq5 (purple).
Figure 5
Figure 5. CSCs and non-stem tumor cells prior to transplantation contain different fractions of stem-like and proliferating cells.
Representative micrographs (A) and bar graph (B) of expanded cells prior to transplantation demonstrate Sox2 and PH3 expression (red) is higher in the CSC fraction of cells as compared with the non-stem tumor cells. Summary figure depicts marker expression from in vivo and in vitro analyses (C). Scale bar represents 50 µm. Data displayed as mean values +/− S.E.M. ***, p<0.001 and N.S. represents not significant (p>0.05) as assessed by one-way analysis of variance (ANOVA), nuclei counterstained with Hoechst 33342 (blue).

References

    1. Anderson K, Lutz C, van Delft FW, Bateman CM, Guo Y, et al. Genetic variegation of clonal architecture and propagating cells in leukaemia. Nature. 2011;469:356–361. - PubMed
    1. Reya T, Morrison SJ, Clarke MF, Weissman IL. Stem cells, cancer, and cancer stem cells. Nature. 2001;414:105–111. - PubMed
    1. Quintana E, Shackleton M, Sabel MS, Fullen DR, Johnson TM, et al. Efficient tumour formation by single human melanoma cells. Nature. 2008;456:593–598. - PMC - PubMed
    1. Rosen JM, Jordan CT. The increasing complexity of the cancer stem cell paradigm. Science. 2009;324:1670–1673. - PMC - PubMed
    1. Colmone A, Amorim M, Pontier AL, Wang S, Jablonski E, et al. Leukemic cells create bone marrow niches that disrupt the behavior of normal hematopoietic progenitor cells. Science. 2008;322:1861–1865. - PubMed

Publication types

MeSH terms