. 2011 Oct 5;101(7):1580-9.
doi: 10.1016/j.bpj.2011.08.032.

Measurements of the acidification kinetics of single SynaptopHluorin vesicles

Affiliations

Measurements of the acidification kinetics of single SynaptopHluorin vesicles

Kristi L Budzinski et al. Biophys J. .

Abstract

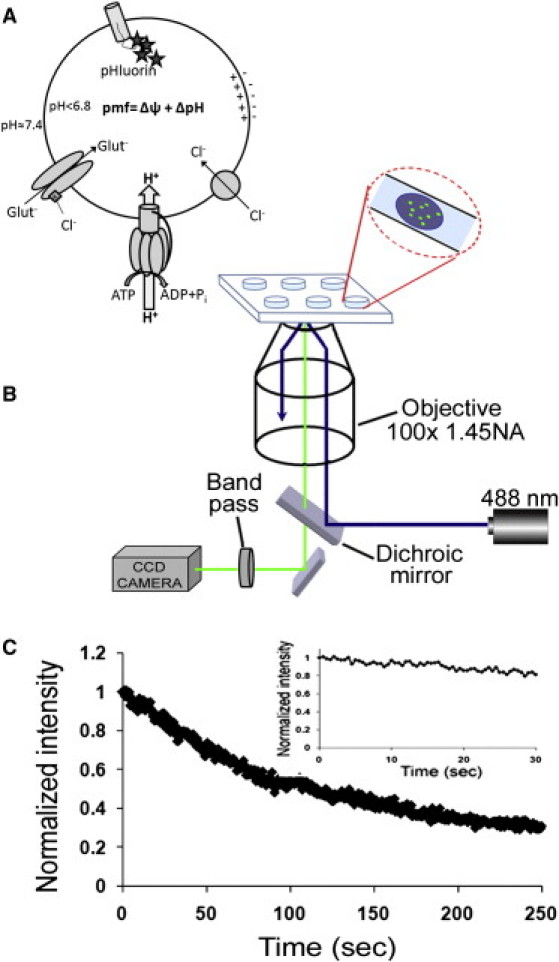
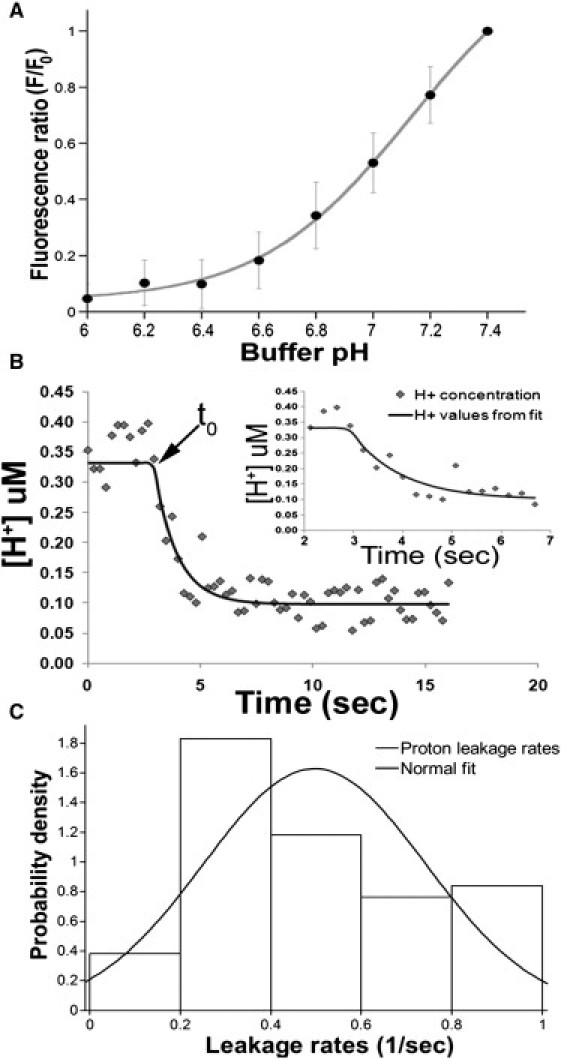
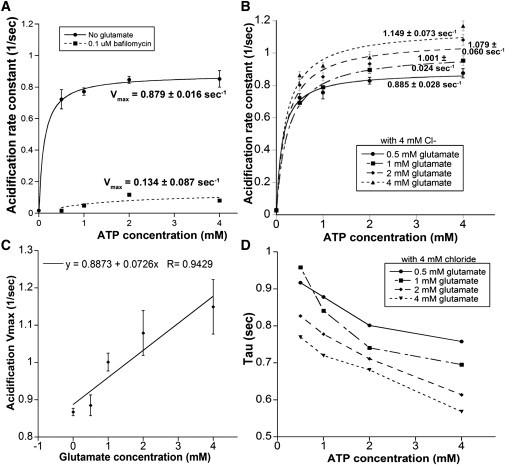
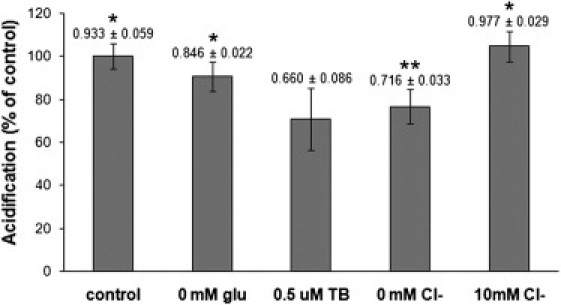
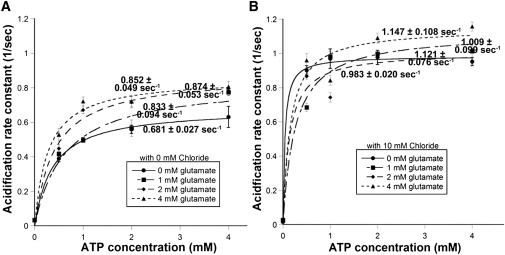
Uptake of neurotransmitters into synaptic vesicles is driven by the proton gradient established across the vesicle membrane. The acidification of synaptic vesicles, therefore, is a crucial component of vesicle function. Here we present measurements of acidification rate constants from isolated, single synaptic vesicles. Vesicles were purified from mice expressing a fusion protein termed SynaptopHluorin created by the fusion of VAMP/synaptobrevin to the pH-sensitive super-ecliptic green fluorescent protein. We calibrated SynaptopHluorin fluorescence to determine the relationship between fluorescence intensity and internal vesicle pH, and used these values to measure the rate constant of vesicle acidification. We also measured the effects of ATP, glutamate, and chloride on acidification. We report acidification time constants of 500 ms to 1 s. The rate of acidification increased with increasing extravesicular concentrations of ATP and glutamate. These data provide an upper and a lower bound for vesicle acidification and indicate that vesicle readiness can be regulated by changes in energy and transmitter availability.


Figures

Figure 1
Figure 1
Measurement of the acidification kinetics of synaptic vesicles using isolated SynaptopHluorin (SpH) vesicles and total-internal-reflection fluorescence (TIRF) microscopy. (A) Schematic representation of the glutamate uptake components. The proton motive force generated by the V-ATPase is utilized by VGLUT to transport glutamate into the vesicle lumen. Chloride (2–8 mM) is required for optimal glutamate loading. In SpH vesicles, pH-sensitive GFP molecules (stars) are bound to the luminal domain of VAMP-2. (B) Home-built TIRF setup using 488-nm laser light as excitation source. SpH vesicles were placed in PDMS well for imaging. Fluorescence was collected with a charge-coupled device camera. (C) SpH vesicle bleaching curve, indicating that photobleaching is insignificant over our experimental timescale (<30 s). (Inset) Bleaching of SpH vesicles over 250 s in load buffer (no ATP or glutamate present); 70% decrease in fluorescence intensity.
Figure 2
Figure 2
Characterization of isolated SpH vesicles. (A) SpH vesicle calibration curve. Vesicles were exchanged into PIPES buffer with 10 μg/mL nigericin at pH 7.4 for the initial intensity measurement, F0. Buffer was then exchanged for each subsequent pH measurement to obtain the corresponding fluorescence intensity, F. Data fit with a single site titration model, which was used to determine the proton concentration at various ratios of fluorescence intensities. (B) Leakage of protons from SpH vesicles. (Open diamonds) Raw data fit to Eq. 2 (solid line). Start of leakage is denoted by t0. (Inset) Expanded view of the fluorescence decay as well as the resulting fit that provided the leakage rate. (C) Histogram of leakage rate constants from individual SpH vesicles. SpH vesicles were equilibrated to pH 6.0 in PIPES buffer then exchanged into PIPES buffer at pH 7.4 with continuous fluorescence monitoring. The rates of proton leakage were binned into a histogram (n = 226) and fit with a normal distribution. The average leakage rate constant determined by the fit was 0.50 ± 0.02 s−1 (mean ± SD).
Figure 3
Figure 3
Effect of glutamate on acidification rates. (A) Acidification due to ATP only. Plot of average acidification rate against ATP concentration (solid line) displays Michaelis-Menten kinetics with a maximum acidification rate of 0.879 ± 0.016 s−1. SpH vesicles treated with 1 μM bafilomycin for 2 min (dotted line) before ATP addition did not acidify (SD of rate measurements is ∼10%). Vmax values are shown with the corresponding curves. (B) Average rates of SpH acidification at varying glutamate concentrations. (Curves) Fit with Michaelis-Menten function; Vmax shown for each curve. (C) Effect of increasing glutamate concentrations on acidification Vmax. Data fit with a linear trend line displaying an R2 value of 0.94. (D) Time constants (τ) of SpH acidification versus ATP concentration. (Lines drawn to guide the eye.)
Figure 4
Figure 4
Effect of inhibiting glutamate transporter on SpH acidification. Comparison of the acidification rates of SpH vesicles at 2 mM ATP when glutamate is present (4 mM; control), when glutamate is absent (0 mM Glu), when VGLUT is blocked by Trypan blue (0.5 μM TB), and in the presence of low (0 mM Cl) or high (10 mM Cl) concentrations of chloride. Acidification rate reduced to ∼90% of control when glutamate was removed but ATP (2 mM) and Cl (4 mM) were present. When VGLUT was blocked, acidification rate was reduced to ∼70% of control similar to the reduction seen (∼76%) when ATP and glutamate were present but chloride was removed (0 mM Cl). High concentrations of chloride (10 mM Cl) did not reduce the acidification rate. Acidification rate (s−1) for each condition shown above bar. Data analyzed with two-tailed unpaired t-tests against the addition of Trypan blue (0.5 μM TB). P < 0.0001; ∗∗P 0.001.
Figure 5
Figure 5
Effect of Cl concentration on the kinetics of SpH vesicle acidification. (A) Rates of SpH acidification measured without Cl at different ATP concentrations with 1 mM glutamate. Removal of chloride resulted in skewed distributions best fit by log-normal distributions (see Fig. S2C). Average acidification rates plotted against ATP concentration and fit with Michaelis-Menten function. The addition of glutamate increased the maximal acidification rate in a statistically significant manner (P < 0.0001 for each glutamate concentration). (B) SpH acidification rates measured in the presence of 10 mM Cl (20 mM HEPES, 104 mM potassium acetate,10 mM KCl, 4 mM MgSO4, pH 7.4) at different ATP/glutamate concentrations. Presence of chloride produced normally distributed acidification rates (see Fig. S2D) from which average acidification rates were determined then plotted against ATP concentration and fit with Michaelis-Menten function. Addition of glutamate increased the acidification rate in a statistically significant manner (P < 0.005).

References

    1. Naito S., Ueda T. Characterization of glutamate uptake into synaptic vesicles. J. Neurochem. 1985;44:99–109. - PubMed
    1. Cidon S., Sihra T.S. Characterization of a H+-ATPase in rat brain synaptic vesicles. Coupling to L-glutamate transport. J. Biol. Chem. 1989;264:8281–8288. - PubMed
    1. Wolosker H., de Souza D.O., de Meis L. Regulation of glutamate transport into synaptic vesicles by chloride and proton gradient. J. Biol. Chem. 1996;271:11726–11731. - PubMed
    1. Whittaker V.P., Michaelson I.A., Kirkland R.J. The separation of synaptic vesicles from nerve-ending particles (‘synaptosomes’) Biochem. J. 1964;90:293–303. - PMC - PubMed
    1. Clerc S., Barenholz Y. A quantitative model for using acridine orange as a transmembrane pH gradient probe. Anal. Biochem. 1998;259:104–111. - PubMed

Publication types