

Interactive, computer-assisted tracking of speckle trajectories in fluorescence microscopy: application to actin polymerization and membrane fusion
- PMID: 21961607
- PMCID: PMC3183794
- DOI: 10.1016/j.bpj.2011.09.007
Interactive, computer-assisted tracking of speckle trajectories in fluorescence microscopy: application to actin polymerization and membrane fusion
Abstract
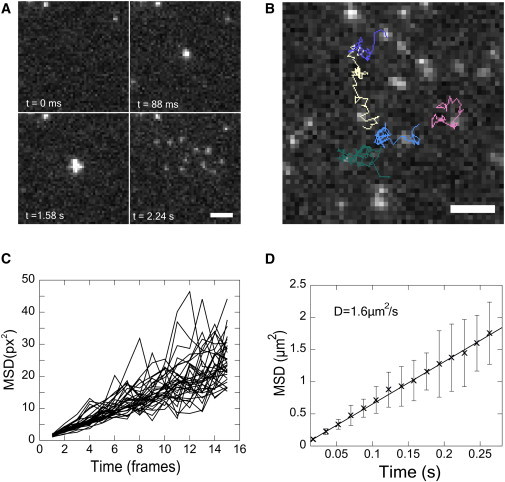
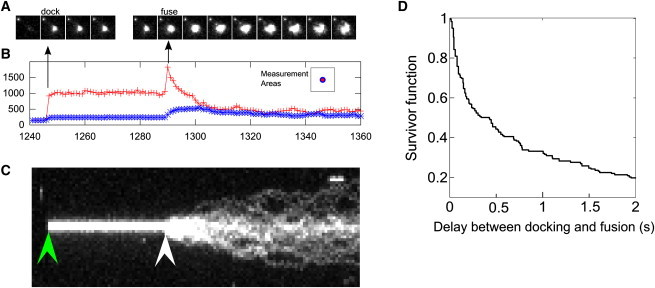
Analysis of particle trajectories in images obtained by fluorescence microscopy reveals biophysical properties such as diffusion coefficient or rates of association and dissociation. Particle tracking and lifetime measurement is often limited by noise, large mobilities, image inhomogeneities, and path crossings. We present Speckle TrackerJ, a tool that addresses some of these challenges using computer-assisted techniques for finding positions and tracking particles in different situations. A dynamic user interface assists in the creation, editing, and refining of particle tracks. The following are results from application of this program: 1), Tracking single molecule diffusion in simulated images. The shape of the diffusing marker on the image changes from speckle to cloud, depending on the relationship of the diffusion coefficient to the camera exposure time. We use these images to illustrate the range of diffusion coefficients that can be measured. 2), We used the program to measure the diffusion coefficient of capping proteins in the lamellipodium. We found values ∼0.5 μm(2)/s, suggesting capping protein association with protein complexes or the membrane. 3), We demonstrate efficient measuring of appearance and disappearance of EGFP-actin speckles within the lamellipodium of motile cells that indicate actin monomer incorporation into the actin filament network. 4), We marked appearance and disappearance events of fluorescently labeled vesicles to supported lipid bilayers and tracked single lipids from the fused vesicle on the bilayer. This is the first time, to our knowledge, that vesicle fusion has been detected with single molecule sensitivity and the program allowed us to perform a quantitative analysis. 5), By discriminating between undocking and fusion events, dwell times for vesicle fusion after vesicle docking to membranes can be measured.
Copyright © 2011 Biophysical Society. Published by Elsevier Inc. All rights reserved.
Figures
Similar articles
-
Model of turnover kinetics in the lamellipodium: implications of slow- and fast- diffusing capping protein and Arp2/3 complex.Phys Biol. 2016 Dec 6;13(6):066009. doi: 10.1088/1478-3975/13/6/066009. Phys Biol. 2016. PMID: 27922825 Free PMC article.
-
Quantitative fluorescent speckle microscopy (QFSM) to measure actin dynamics.Curr Protoc Cytom. 2012 Oct;Chapter 2:Unit2.18. doi: 10.1002/0471142956.cy0218s62. Curr Protoc Cytom. 2012. PMID: 23042526 Free PMC article.
-
Periodic patterns of actin turnover in lamellipodia and lamellae of migrating epithelial cells analyzed by quantitative Fluorescent Speckle Microscopy.Biophys J. 2005 Nov;89(5):3456-69. doi: 10.1529/biophysj.104.058701. Epub 2005 Aug 12. Biophys J. 2005. PMID: 16100274 Free PMC article.
-
Inside view of cell locomotion through single-molecule: fast F-/G-actin cycle and G-actin regulation of polymer restoration.Proc Jpn Acad Ser B Phys Biol Sci. 2010;86(1):62-83. doi: 10.2183/pjab.86.62. Proc Jpn Acad Ser B Phys Biol Sci. 2010. PMID: 20075609 Free PMC article. Review.
-
Visualization of membrane fusion, one particle at a time.Biochemistry. 2013 Mar 12;52(10):1654-68. doi: 10.1021/bi301573w. Epub 2013 Feb 19. Biochemistry. 2013. PMID: 23421412 Review.
Cited by
-
F- and G-actin homeostasis regulates mechanosensitive actin nucleation by formins.Nat Cell Biol. 2013 Apr;15(4):395-405. doi: 10.1038/ncb2693. Epub 2013 Mar 3. Nat Cell Biol. 2013. PMID: 23455479
-
A Nanodisc-Cell Fusion Assay with Single-Pore Sensitivity and Sub-millisecond Time Resolution.Methods Mol Biol. 2019;1860:263-275. doi: 10.1007/978-1-4939-8760-3_17. Methods Mol Biol. 2019. PMID: 30317511 Free PMC article.
-
Controlled electromechanical cell stimulation on-a-chip.Sci Rep. 2015 Jul 2;5:11800. doi: 10.1038/srep11800. Sci Rep. 2015. PMID: 26135970 Free PMC article.
-
New single-molecule speckle microscopy reveals modification of the retrograde actin flow by focal adhesions at nanometer scales.Mol Biol Cell. 2014 Apr;25(7):1010-24. doi: 10.1091/mbc.E13-03-0162. Epub 2014 Feb 5. Mol Biol Cell. 2014. PMID: 24501425 Free PMC article.
-
Distributed actin turnover in the lamellipodium and FRAP kinetics.Biophys J. 2013 Jan 8;104(1):247-57. doi: 10.1016/j.bpj.2012.11.3819. Epub 2013 Jan 8. Biophys J. 2013. PMID: 23332077 Free PMC article.
References
-
- Meijering E., Dzyubachyk O., van Cappellen W.A. Tracking in cell and developmental biology. Semin. Cell Dev. Biol. 2009;20:894–902. - PubMed
-
- Jaqaman K., Danuser G. Cold Spring Harbor Press; Cold Spring Harbor, NY: 2009. Computational Image Analysis of Cellular Dynamics: A Case Study Based on Particle Tracking. (This article can be found online, http://cshprotocols.cshlp.org/content/2009/12/pdb.top65.abstract). - PMC - PubMed
-
- Crocker J.C., Hoffman B.D. Multiple-particle tracking and two-point microrheology in cells. Methods Cell Biol. 2007;83:141–178. - PubMed
-
- Wirtz D. Particle-tracking microrheology of living cells: principles and applications. Annu. Rev. Biophys. 2009;38:301–326. - PubMed
Publication types
MeSH terms
Substances
Grants and funding
LinkOut - more resources
Full Text Sources
Other Literature Sources
