. 2011 Oct 1:11:420.
doi: 10.1186/1471-2407-11-420.

The combination of gefitinib and RAD001 inhibits growth of HER2 overexpressing breast cancer cells and tumors irrespective of trastuzumab sensitivity

Affiliations

The combination of gefitinib and RAD001 inhibits growth of HER2 overexpressing breast cancer cells and tumors irrespective of trastuzumab sensitivity

Wieslawa H Dragowska et al. BMC Cancer. .

Abstract

Background: HER2-positive breast cancers exhibit high rates of innate and acquired resistance to trastuzumab (TZ), a HER2-directed antibody used as a first line treatment for this disease. TZ resistance may in part be mediated by frequent co-expression of EGFR and by sustained activation of the mammalian target of rapamycin (mTOR) pathway. Here, we assessed feasibility of combining the EGFR inhibitor gefitinib and the mTOR inhibitor everolimus (RAD001) for treating HER2 overexpressing breast cancers with different sensitivity to TZ.

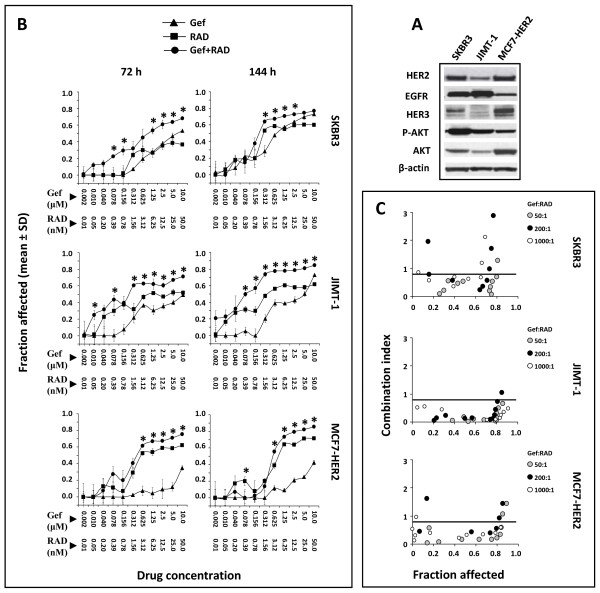
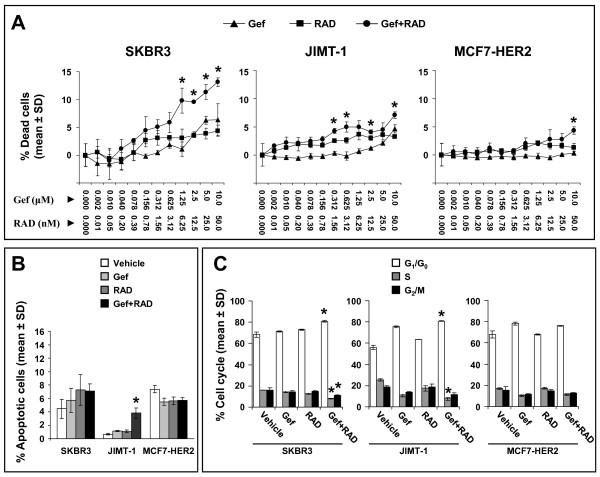
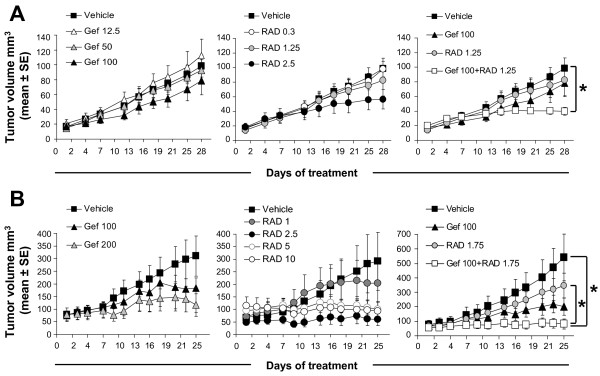
Methods: The gefitinib and RAD001 combination was broadly evaluated in TZ sensitive (SKBR3 and MCF7-HER2) and TZ resistant (JIMT-1) breast cancer models. The effects on cell growth were measured in cell based assays using the fixed molar ratio design and the median effect principle. In vivo studies were performed in Rag2M mice bearing established tumors. Analysis of cell cycle, changes in targeted signaling pathways and tumor characteristics were conducted to assess gefitinib and RAD001 interactions.

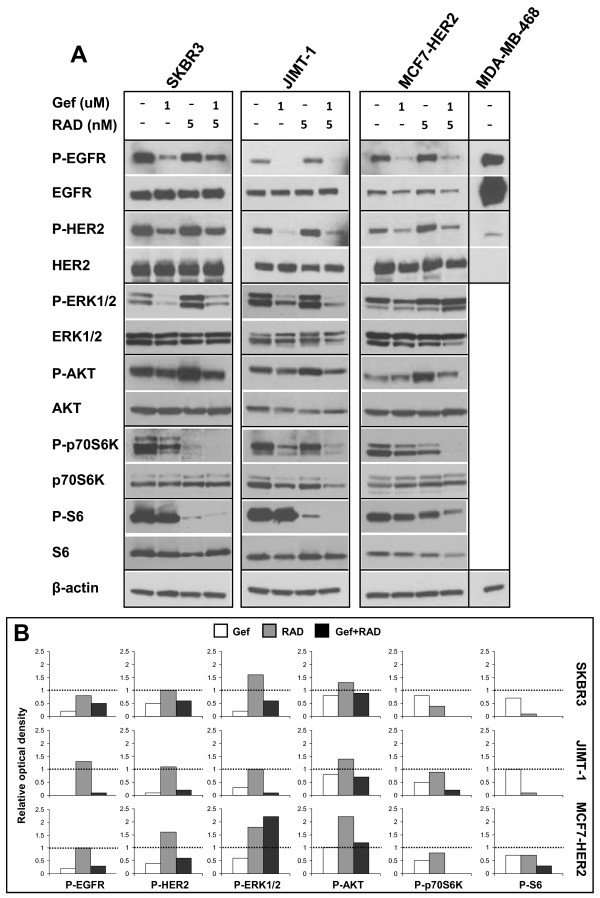
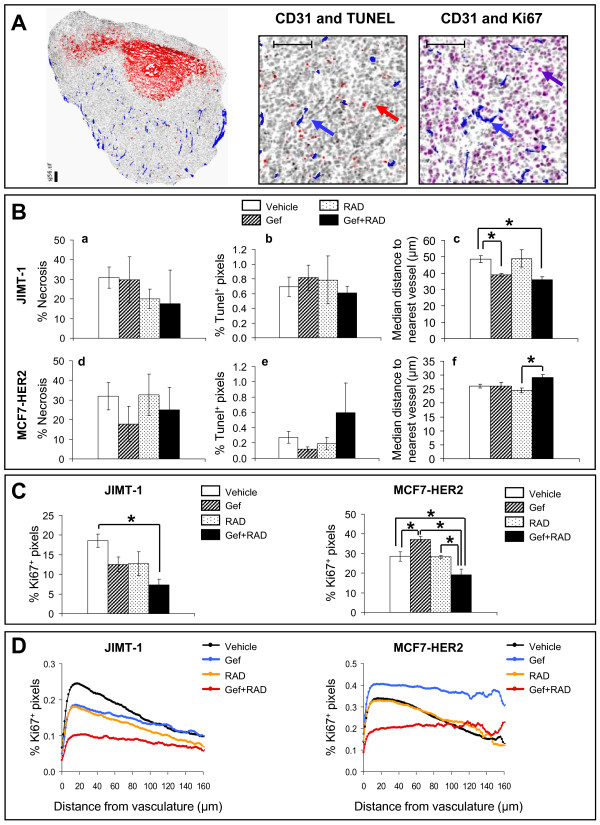
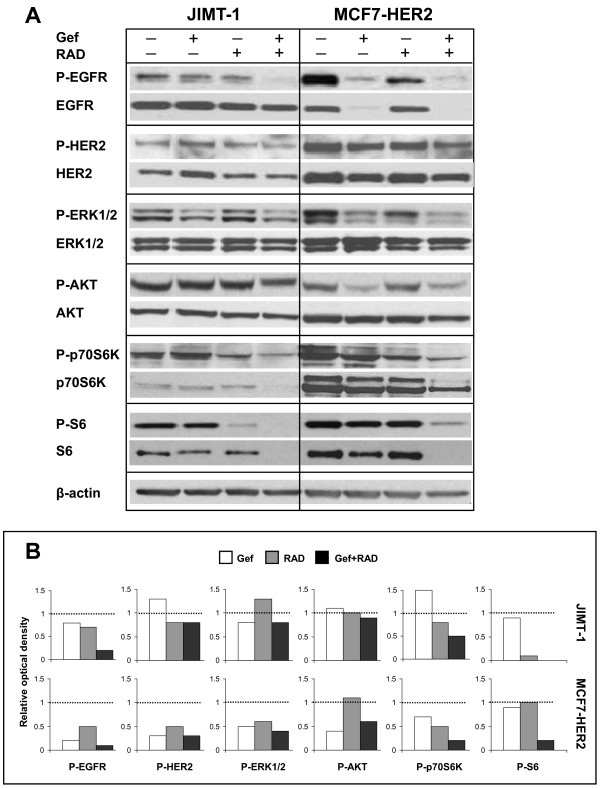
Results: The gefitinib and RAD001 combination inhibited cell growth in vitro in a synergistic fashion as defined by the Chou and Talalay median effect principle and increased tumor xenograft growth delay. The improvement in therapeutic efficacy by the combination was associated in vitro with cell line dependent increases in cytotoxicity and cytostasis while treatment in vivo promoted cytostasis. The most striking and consistent therapeutic effect of the combination was increased inhibition of the mTOR pathway (in vitro and in vivo) and EGFR signaling in vivo relative to the single drugs.

Conclusions: The gefitinib and RAD001 combination provides effective control over growth of HER2 overexpressing cells and tumors irrespective of the TZ sensitivity status.


Figures

Figure 1
Figure 1
Phenotypic analysis and in vitro sensitivity of SKBR3, JIMT-1 and MCF7-HER2 cells to gefitinib, RAD001, or the gefitinib and RAD001 combination. (A) Expression of HER2, EGFR, HER3, P-AKT and AKT analyzed by Western blotting. (B) Cells were treated for 72 or 144 h with gefitinib (Gef), RAD001 (RAD) and the gefitinib and RAD001 combination at 200:1 molar ratio (Gef:RAD). Cell viability curves were plotted based on data obtained with an Alamar Blue assay and reported as Fa (fraction of cells affected by the treatment, where 1 is equivalent to 100% cytotoxicity). Each data point represents the mean ± SD of 3 wells. Asterisks above data points indicate significantly (p < 0.05) greater Fa in the combination treated cells compared to the single drugs. Achievable levels of gefitinib and rapamycin analogs reported in human blood are ~ 1 μM and 5-15 nM, respectively. All cell lines were screened 3 times with single drugs and 2-3 times with the drug combinations to assure consistency. The results presented are from a representative experiment. (C) The combination index (CI) was calculated with the CompuSyn™ software based on data derived from Alamar Blue assay completed in cells treated with the single drugs and drug combinations at the indicated molar ratios and plotted versus Fa. Each data point moving from left to right for any given ratio of gefitinib to RAD001 represents an effect of increasing drug concentrations. The data points below CI values of 0.8, denoted by a horizontal line on each plot, are indicative of synergistic interactions.
Figure 2
Figure 2
Assessment of cell death, apoptosis and cell cycle in SKBR3, JIMT-1 and MCF7-HER2 cells treated with gefitinib, RAD001 and the gefitinib and RAD001 combination used at 200:1 (Gef:RAD) molar ratio. (A) Assessment of cell death by HCS. Cells were seeded in 96-well plates and treated with indicated drug concentration. After 72 h cells were stained in situ with DRAQ5 (stain for viable cells) and ethidium homodimer (stain for dead cells) and images were acquired with IN Cell 1000. The imaging data were analyzed with the IN Cell 1000 Investigator software and the results are expressed as percentage of dead cells relative to DMSO control. Asterisks above data points indicate a significantly (p < 0.05) greater percentage of dead cells in the combination treated cells compared to cells treated with gefitinib or RAD001 alone. Achievable levels of gefitinib and rapamycin analogs reported in human blood are ~ 1 μM and 5-15 nM, respectively. Each data point represents the mean ± SD from 3 replicate wells. Data from representative experiments are shown. (B - C) Flow cytometric analysis of apoptosis (B) and cell cycle (C) in cells treated with 1 μM gefitinib (Gef), 5 nM RAD001 (RAD) or the combination of both drugs at 200:1 (Gef:RAD) molar ratio. Each bar represents a mean ± SD from 3 replicate samples. Asterisks indicate a significant difference (p < 0.05) between cells treated with the gefitinib and RAD001 combination compared to the single drugs. Representative experiments are shown.
Figure 3
Figure 3
In vitro molecular responses to gefitinib, RAD001 and the gefitinib and RAD001 combination. SKBR3, JIMT-1 and MCF7-HER2 cells were treated for 72 h with indicated concentrations of gefitinib (Gef), RAD001 (RAD) or the combination of both drugs at a 200:1 (Gef:RAD) molar ratio. Cell lysates were prepared from harvested cells and expression of phospho- and corresponding total protein were analyzed with Western blotting. (A) Representative images of protein bands. (B) The expression of phosphorylated proteins, as shown in (A) was measured by densitometry and normalized to the vehicle control expressed as 1 and denoted by a dotted line in each histogram. β-actin was used to control for equal loading. The MDA-MB-468 cell line with a high EGFR and negligible HER2 expression was used to control for specificity of the anti P-EGFR and P-HER2 antibodies.
Figure 4
Figure 4
Efficacy of gefitinib, RAD001 and the combination in JIMT-1 and MCF7-HER2 tumors. S.c. tumors were established in Rag2M mice and animals were treated for 28 days (JIMT-1) or 25 days (MCF7-HER2) with the indicated drugs. Growth curves of (A) JIMT-1 and (B) MCF7-HER2 tumors (n = 6 mice/treatment group) plotted based on tumor volume. Numbers in figure legends indicate drug doses in mg/kg of body mass. Asterisks represent a significant (p < 0.05) difference between the average tumor volume on the last day of treatment between indicated groups.
Figure 5
Figure 5
Immunohistochemical analysis of tumor tissue sections. (A) Left panel: representative image of a whole tumor section stained with anti-CD31 antibody (blue), Hoechst 33342 (gray), and TUNEL (red) to label vasculature, nuclei and apoptosis, respectively. Vast red areas in tumor tissue represent continuous apoptosis regions, referred to as "necrosis". Middle panel: a magnified image of a viable area in tumor tissue section shown in the left panel; a blue arrow indicates a CD31 positive blood vessel; a red arrow indicates a TUNEL-positive apoptotic cell. Right panel: representative image of a viable area in the tumor tissue section stained with Hoechst 33342 (grey), anti-CD31 antibody to label blood vessels (a blue arrow) and anti-Ki67 antibody to label proliferating cells (a purple arrow). Scale bars: 150 μM. (B) Quantification of necrosis (a and d), apoptosis (b and e) and vascularization (c and f) in tumor tissue sections. Apoptosis is shown as % TUNEL-positive pixels within viable tumor tissue. The median distance from viable tumor tissue to the nearest vessel reflects microvessel density; the greater the vessel distance, the lower the microvessel density and vice versa. (C) The percentage of Ki67-positive pixels in viable tumor tissue. Bars in B and C represent the mean ± SE calculated from 4-5 tumors per treatment group and asterisks denote a statistically significant difference (p < 0.05) between the indicated groups. (D) Mean distribution of Ki67 positive pixels relative to CD31-stained vessels mapped in tumor tissue sections. The IHC analysis was completed twice using different cryosections to assure consistency of the results.
Figure 6
Figure 6
In vivo molecular responses to gefitinib, RAD001 and the gefitinib and RAD001 combination. Western blot analysis of phospho- and corresponding total protein levels in tissue lysates derived from JIMT-1 and MCF7-HER2 tumors harvested from Rag2M mice at the end of treatment. Animals bearing JIMT-1 tumors were treated with 100 mg/kg gefitinib (Gef), 1.25 mg/kg RAD001 (RAD) and the combination of both drugs and animals bearing MCF7-HER2 were treated with 100 mg/kg gefitinib, 1.75 mg/kg RAD001 and the combination of both drugs. Protein concentration in tumor tissue lysates from individual tumors was adjusted to 50 mg/ml and an equal volume of each individual tumor lysate was pooled for loading gels. Results from six pooled tumor lysates per lane are shown. (A) Representative images of protein bands. (B) The phosphoprotein levels shown in (A) relative to β-actin were determined by densitometry and normalized to the vehicle control expressed as 1 and denoted by a dotted line in each histogram.

Similar articles

Cited by

References

    1. Wiseman SM, Makretsov N, Nielsen TO, Gilks B, Yorida E, Cheang M, Turbin D, Gelmon K, Huntsman DG. Coexpression of the type 1 growth factor receptor family members HER-1, HER-2, and HER-3 has a synergistic negative prognostic effect on breast carcinoma survival. Cancer. 2005;103(9):1770–1777. doi: 10.1002/cncr.20970. - DOI - PubMed
    1. Slamon DJ, Clark GM, Wong SG, Levin WJ, Ullrich A, McGuire WL. Human breast cancer: correlation of relapse and survival with amplification of the HER-2/neu oncogene. Science. 1987;235(4785):177–182. doi: 10.1126/science.3798106. - DOI - PubMed
    1. Knuefermann C, Lu Y, Liu B, Jin W, Liang K, Wu L, Schmidt M, Mills GB, Mendelsohn J, Fan Z. HER2/PI-3K/Akt activation leads to a multidrug resistance in human breast adenocarcinoma cells. Oncogene. 2003;22(21):3205–3212. doi: 10.1038/sj.onc.1206394. - DOI - PubMed
    1. Liang K, Lu Y, Jin W, Ang KK, Milas L, Fan Z. Sensitization of breast cancer cells to radiation by trastuzumab. Mol Cancer Ther. 2003;2(11):1113–1120. - PubMed
    1. Hynes NE, Lane HA. ERBB receptors and cancer: the complexity of targeted inhibitors. Nat Rev Cancer. 2005;5(5):341–354. doi: 10.1038/nrc1609. - DOI - PubMed

Publication types

MeSH terms