. 2011 Oct 2:11:421.
doi: 10.1186/1471-2407-11-421.

Role of protein kinase C and epidermal growth factor receptor signalling in growth stimulation by neurotensin in colon carcinoma cells

Affiliations

Role of protein kinase C and epidermal growth factor receptor signalling in growth stimulation by neurotensin in colon carcinoma cells

Kristin M Müller et al. BMC Cancer. .

Abstract

Background: Neurotensin has been found to promote colon carcinogenesis in rats and mice, and proliferation of human colon carcinoma cell lines, but the mechanisms involved are not clear. We have examined signalling pathways activated by neurotensin in colorectal and pancreatic carcinoma cells.

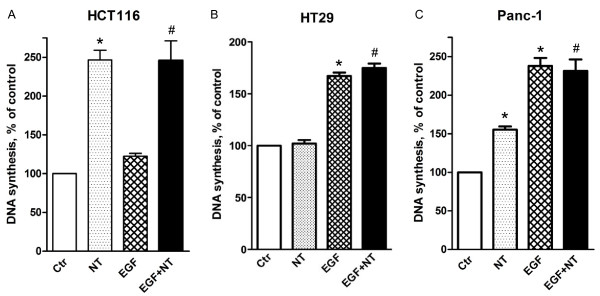
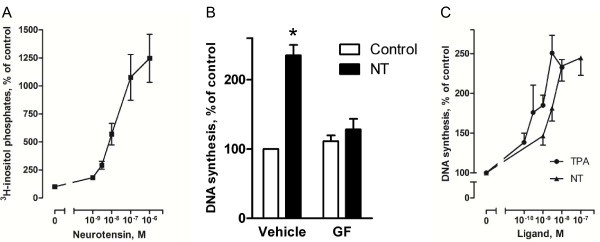
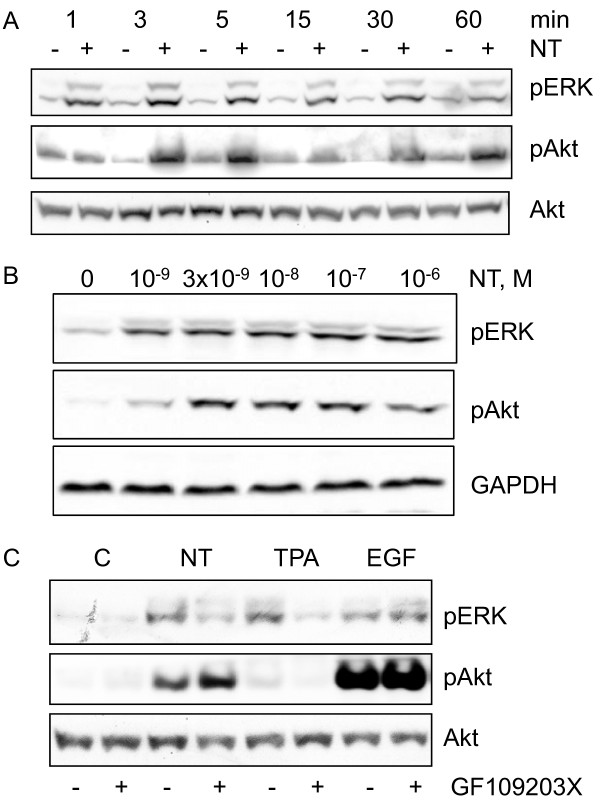
Methods: Colon carcinoma cell lines HCT116 and HT29 and pancreatic adenocarcinoma cell line Panc-1 were cultured and stimulated with neurotensin or epidermal growth factor (EGF). DNA synthesis was determined by incorporation of radiolabelled thymidine into DNA. Levels and phosphorylation of proteins in signalling pathways were assessed by Western blotting.

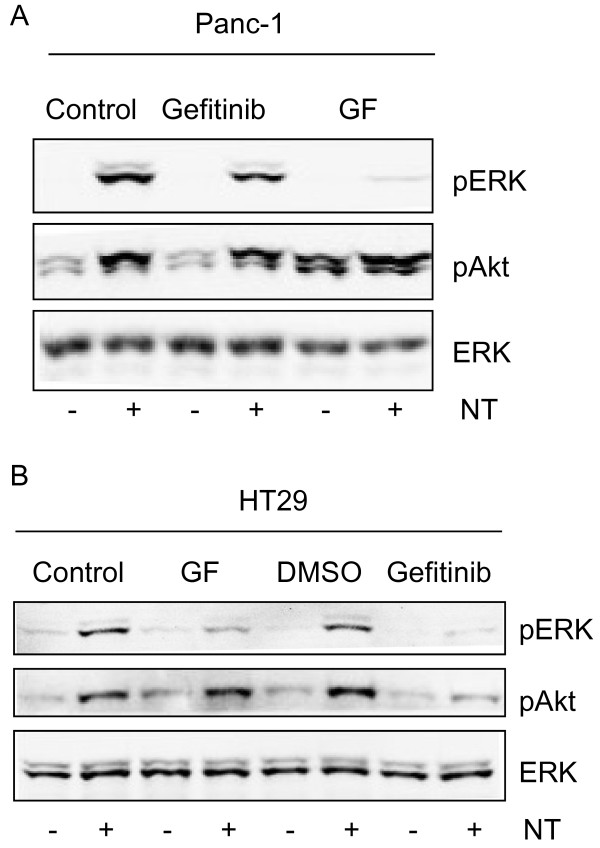
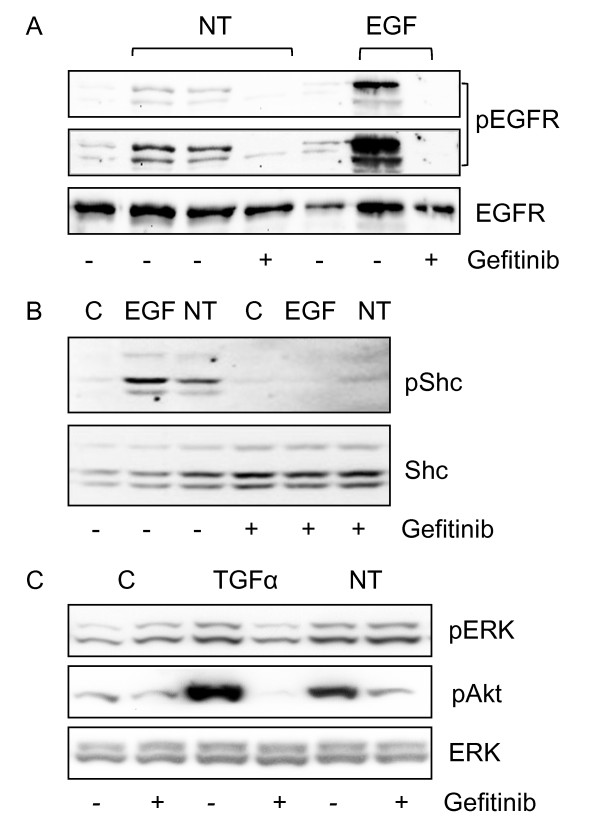
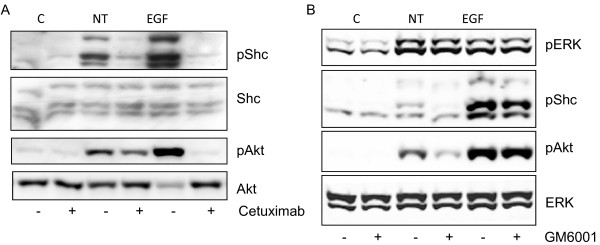
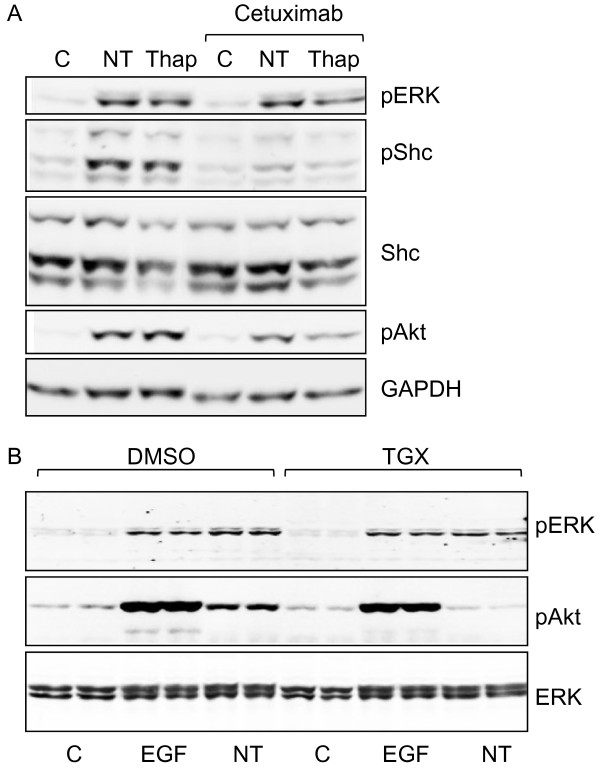
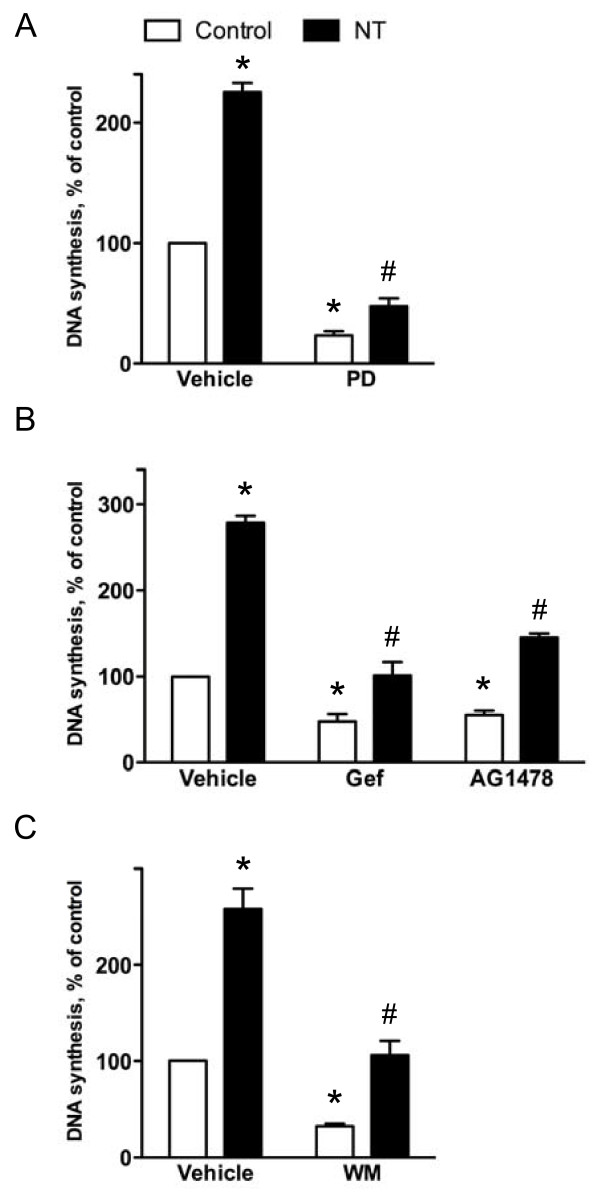
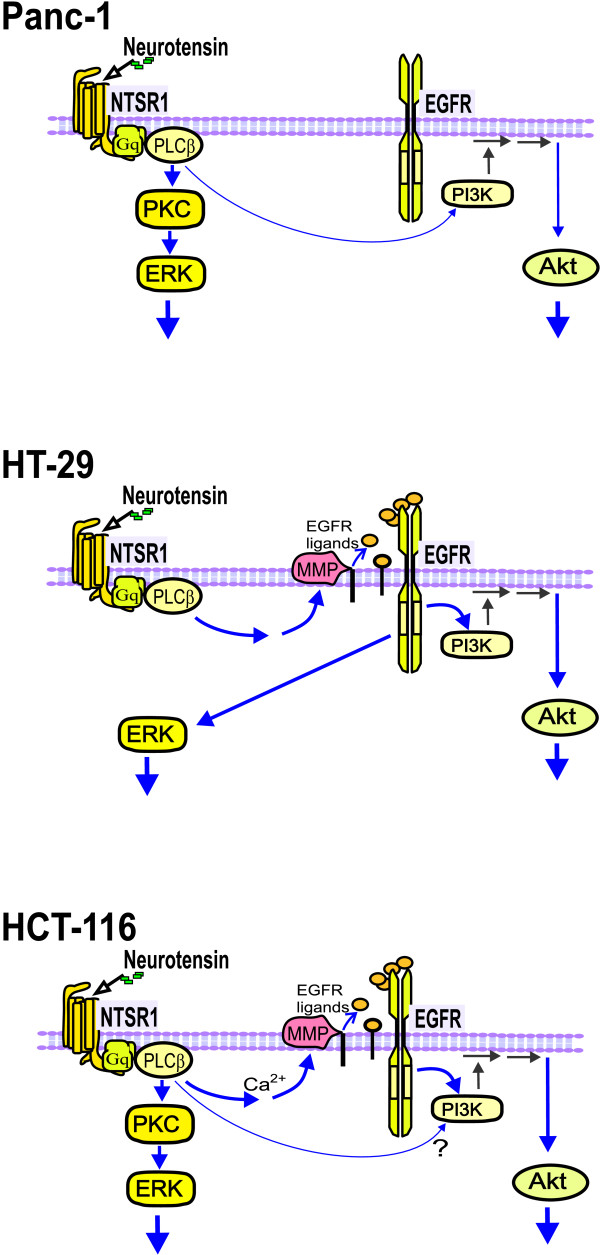
Results: Neurotensin stimulated the phosphorylation of both extracellular signal-regulated kinase (ERK) and Akt in all three cell lines, but apparently did so through different pathways. In Panc-1 cells, neurotensin-induced phosphorylation of ERK, but not Akt, was dependent on protein kinase C (PKC), whereas an inhibitor of the β-isoform of phosphoinositide 3-kinase (PI3K), TGX221, abolished neurotensin-induced Akt phosphorylation in these cells, and there was no evidence of EGF receptor (EGFR) transactivation. In HT29 cells, in contrast, the EGFR tyrosine kinase inhibitor gefitinib blocked neurotensin-stimulated phosphorylation of both ERK and Akt, indicating transactivation of EGFR, independently of PKC. In HCT116 cells, neurotensin induced both a PKC-dependent phosphorylation of ERK and a metalloproteinase-mediated transactivation of EGFR that was associated with a gefitinib-sensitive phosphorylation of the downstream adaptor protein Shc. The activation of Akt was also inhibited by gefitinib, but only partly, suggesting a mechanism in addition to EGFR transactivation. Inhibition of PKC blocked neurotensin-induced DNA synthesis in HCT116 cells.

Conclusions: While acting predominantly through PKC in Panc-1 cells and via EGFR transactivation in HT29 cells, neurotensin used both these pathways in HCT116 cells. In these cells, neurotensin-induced activation of ERK and stimulation of DNA synthesis was PKC-dependent, whereas activation of the PI3K/Akt pathway was mediated by stimulation of metalloproteinases and subsequent transactivation of the EGFR. Thus, the data show that the signalling mechanisms mediating the effects of neurotensin involve multiple pathways and are cell-dependent.


Figures

Figure 1
Figure 1
Effect of EGF and neurotensin alone and in combination on DNA synthesis. Quiescent HCT116 (A), HT29 (B), and Panc-1 (C) cells were treated with 5 nM EGF, 1 μM neurotensin (NT), or a combination of both agents. [3 H]thymidine was added 12 h (HCT116) or 21 h after addition of agonists. The cells were harvested three hours after adding [3 H]thymidine and DNA synthesis was assessed as described in Methods. The results are presented as per cent of control values of three (HCT116) or six (HT29, Panc-1) independent experiments. Error bars indicate S.E.M. * Significantly different (p < 0.05) from control; # significantly different from control (p < 0.05), but not from neurotensin alone (A) or EGF alone (B, C).
Figure 2
Figure 2
Role of PKC in neurotensin-stimulated DNA synthesis in HCT116 cells. A, Dose-response curve for the effect of neurotensin (NT) on accumulation of [3 H] inositol phosphates in the presence of 15 mM LiCl. Cells were labeled with [3 H]-inositol for 24 hours before NT was added to quiescent cells at the concentrations indicated. The reaction was stopped after 30 minutes, and inositol phosphates were extracted and analyzed as described in Methods. Results are presented as per cent of control values ± S.E.M., n = 3. B, Effect of the PKC inhibitor, GF109203X (GF) on basal and NT-induced DNA synthesis. Quiescent cells were pretreated with 3.5 μM GF109203X for 30 min before stimulation with 1 μM NT. Based on dose-response curves for the effect of GF109203X on NT-induced DNA synthesis we found 3.5 μM to be the maximum concentration tolerated by our cells (data not shown). DNA synthesis was determined by [3 H]thymidine incorporation as described in the legend of figure 1. Results are presented as per cent of control values of seven independent experiments. Error bars indicate S.E.M. * Significantly different from control (p < 0.05). C, Dose-response curves for the effects of NT or TPA on DNA synthesis. Quiescent cells were treated with the respective agonists in the concentrations indicated. DNA synthesis was determined by [3 H]thymidine incorporation as described in the legend of figure 1. The results are presented as per cent of control values ± S.E.M. of six independent experiments.
Figure 3
Figure 3
Time-course and PKC-dependency of ERK and Akt phosphorylation in HCT116 cells. A, Time-course of neurotensin-induced phosphorylation of ERK and Akt. Quiescent cells were stimulated with 1 μM neurotensin (NT) for the times indicated. Cells were harvested for subsequent Western analysis as described in Methods. Results represent one typical of three independent experiments. B, Effect of increasing concentrations of neurotensin on phosphorylation of ERK and Akt. Quiescent cells were stimulated with increasing concentrations of neurotensin for five minutes. Cells were harvested for subsequent Western analysis as described in Methods. Results represent one typical of three experiments. C, Role of PKC in NT-induced phosphorylation of ERK and Akt. Quiescent cells were pretreated with vehicle (0.9% NaCl) or 3.5 μM GF109203X for 30 min, before stimulation with 1 μM NT, 1 μM TPA, or 5 nM EGF for five min and then harvested for subsequent Western analysis. Results represent one typical of eight independent experiments.
Figure 4
Figure 4
Role of PKC and EGF receptor in neurotensin-induced signalling in HT29 and Panc-1 cells. Panc-1(A) and HT29 (B) cells were pretreated with vehicle (0.9% NaCl or 0.5% DMSO), 3.5 μM GF109203X, or 1 μM gefitinib for 30 min before stimulation with 1 μM neurotensin (NT) for 5 min. Cells were harvested for subsequent Western analysis as described in Methods. Results represent one typical of four independent experiments.
Figure 5
Figure 5
Role of EGFR in neurotensin-induced signalling in HCT116 cells. A, Phosphorylation of the EGFR residue 1173 induced by neurotensin (NT) and EGF. Quiescent cells were pretreated with vehicle (0.5% DMSO) or 10 μM gefitinib for 30 min before stimulation with 1 μM NT or 5 nM EGF for five min. Cells were harvested for subsequent Western analysis as described in Methods. Because of the strong EGFR phosphorylation induced by EGF, we also show the same blot overexposed. Results represent one typical of three independent experiments. B, Phosphorylation of Shc induced by NT and EGF in cells pretreated with vehicle or gefitinib. Results represent one typical of three independent experiments. C, Phosphorylation of ERK and Akt induced by NT (1 μM) and TGFα (10 nM) in cells pretreated with vehicle or 10 μM gefitinib for 30 min before stimulation. Results represent one typical of four independent experiments.
Figure 6
Figure 6
Role of EGFR in neurotensin-induced phosphorylation of ERK, Akt, and Shc in HCT116 cells. A, Effect of EGFR inhibition on neurotensin (NT)-induced signalling. Quiescent cells were pretreated with 25 μg/ml cetuximab for 30 min before stimulation with 1 μM NT or 10 nM EGF for five min. Cells were harvested for subsequent Western analysis as described in Methods. Results represent one typical of four independent experiments. B, Effect of protease inhibition on NT-induced phosphorylation of downstream proteins. Quiescent cells were pretreated with 10 μM GM6001 for 30 min prior to stimulation with 1 μM NT or 10 nM EGF for five min. Results represent one typical of six independent experiments.
Figure 7
Figure 7
Role of calcium in phosphorylation of ERK, Akt, and Shc. A, Effect of thapsigargin (Thap) and neurotensin (NT) on phosphorylation of ERK, Akt, and Shc in HCT116 cells. Quiescent cells were pretreated with vehicle (0.9% NaCl) or cetuximab (25 μg/ml) for 30 min before stimulation with the vehicle (0.5% DMSO), 1 μM NT, or 1 μM Thap for five min. Cells were harvested for subsequent Western analysis as described in Methods. Results represent one typical of three independent experiments. B, Effect of PI3Kβ inhibitor on NT-stimulated ERK and Akt phosphorylation in Panc-1 cells. Quiescent cells were pretreated with vehicle (0.5% DMSO) or 1 μM TGX-221 for 30 min before stimulation with 10 nM EGF or 1 μM neurotensin (NT) for 5 min. Cells were harvested for subsequent Western analysis as described in Methods. Results represent one typical of four experiments.
Figure 8
Figure 8
Signalling pathways involved in neurotensin-stimulated DNA synthesis in HCT116 cells. A, Effect of MEK inhibition on basal and neurotensin (NT)-induced DNA synthesis. Quiescent cells were pretreated with vehicle (0.5% DMSO) or 50 μM PD98059 (PD) for 30 min before stimulation with the vehicle (0.9% NaCl) or 1 μM NT. Data are presented as per cent of control values of six independent experiments. Error bars indicate S.E.M. * Significantly different from vehicle-treated control (p < 0.05), #significantly different from control cells pretreated with PD98059 (p < 0.05). B, Effect of EGFR kinase inhibitors on DNA synthesis induced by neurotensin. Quiescent cells were pretreated for 30 min with vehicle (0.5% DMSO), 10 μM gefitinib (Gef), or 10 μM AG1478 prior to stimulation with 1 μM NT. Data are presented as per cent of control values of four (AG1478) or seven (gefitinib) independent experiments. Error bars indicate S.E.M. * Significantly different from vehicle-treated control (p < 0.05), #significantly different from control cells pretreated with gefitinib or AG1478 (p < 0.05). C, Effect of phosphoinositide 3-kinase inhibition on DNA synthesis induced by neurotensin. Quiescent cells were pretreated for 30 min with vehicle (0.5% DMSO) or 1 μM wortmannin (WM) prior to stimulation with 1 μM NT. DNA synthesis was determined by [3 H]thymidine incorporation as described in the legend of figure 1. Data are presented as per cent of control values of six independent experiments. Error bars indicate S.E.M. * Significantly different from vehicle-treated control (p < 0.05), #significantly different from control cells pretreated with wortmannin (p < 0.05).
Figure 9
Figure 9
Summary of pathways activated by neurotensin in HCT116, HT29, and Panc-1 cells.

Similar articles

Cited by

References

    1. Jemal A, Bray F, Center MM, Ferlay J, Ward E, Forman D. Global cancer statistics. CA Cancer J Clin. 2011;61:69–90. doi: 10.3322/caac.20107. - DOI - PubMed
    1. Dorsam RT, Gutkind JS. G-protein-coupled receptors and cancer. Nat Rev Cancer. 2007;7:79–94. doi: 10.1038/nrc2069. - DOI - PubMed
    1. Rozengurt E. Mitogenic signaling pathways induced by G protein-coupled receptors. J Cell Physiol. 2007;213:589–602. doi: 10.1002/jcp.21246. - DOI - PubMed
    1. Wang D, Dubois RN. Eicosanoids and cancer. Nat Rev Cancer. 2010;10:181–93. doi: 10.1038/nrc2809. - DOI - PMC - PubMed
    1. Neves SR, Ram PT, Iyengar R. G protein pathways. Science. 2002;296:1636–9. doi: 10.1126/science.1071550. - DOI - PubMed

Publication types