

Beverage patterns and trends among school-aged children in the US, 1989-2008
- PMID: 21962086
- PMCID: PMC3196913
- DOI: 10.1186/1475-2891-10-103
Beverage patterns and trends among school-aged children in the US, 1989-2008
Abstract
Background: High intake of sugar-sweetened beverages in childhood is linked to increased risk of obesity and type II diabetes later in life. Using three nationally representative surveys of dietary intake, we investigated beverage patterns and trends among US school-aged children from 1989/91 to 2007/08.
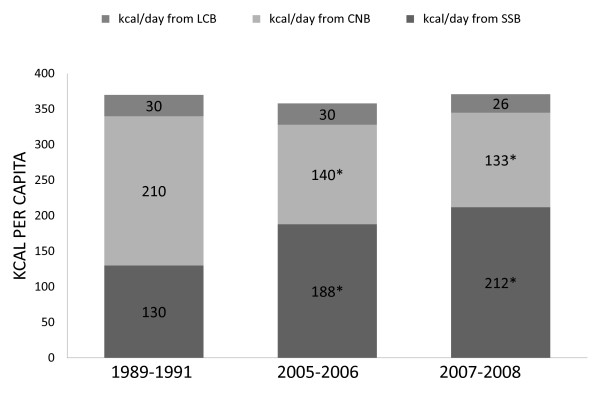
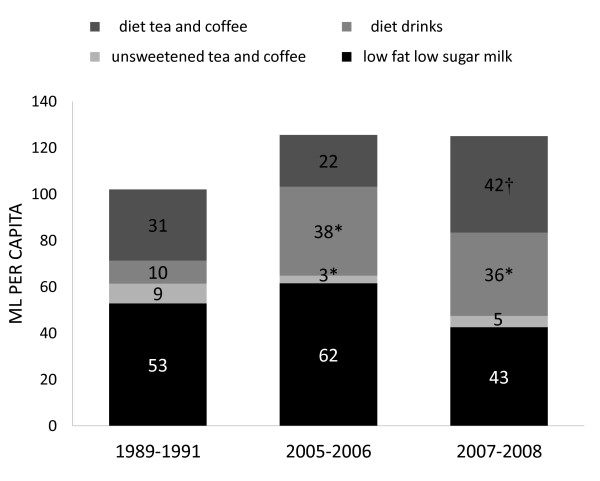
Methods: 3, 583 participants ages 6-11 y old were included. We reported per capita trends in beverage consumption, percent consuming, and amount per consumer for the following categories of beverages: sugar-sweetened beverages (SSB), caloric nutritional beverages (CNB) and low calorie beverages (LCB). Statistically significant differences were tested using the Student's t test in Stata 11.
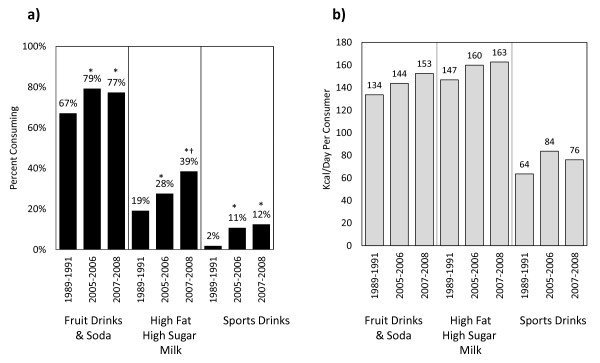
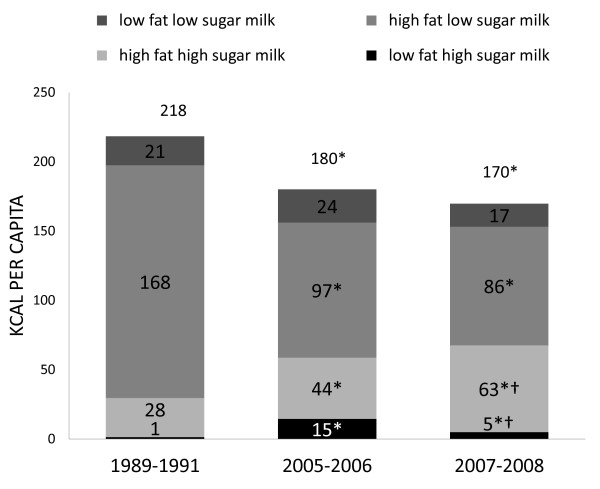
Results: While per capita kcal contribution from total beverages remained constant over the study period, per capita consumption of SSBs increased and CNBs decreased in similar magnitude. The substantial increase in consumption of certain SSBs, such as fruit drinks and soda, high fat high sugar milk, and sports drinks, coupled with the decrease in consumption of high fat low sugar milk was responsible for this shift. The percent consuming SSBs as well as the amount per consumer increased significantly over time. Per capita intake of total milk declined, but the caloric contribution from high fat high sugar milk increased substantially. Among ethnicities, important differences in consumption trends of certain SSBs and 100% juice indicate the complexity in determining strategies for children's beverage calorie reduction.
Conclusions: As upward trends of SSB consumption parallel increases in childhood obesity, educational and policy interventions should be considered.
Figures
References
-
- Committee on Nutrition. The Use and Misuse of Fruit Juice in Pediatrics. Pediatrics. 2001;107(5):1210–1213. - PubMed
-
- Slining MM, Popkin, Barry M. University of North Carolina at Chapel Hill. Chapel Hill, NC; 2011. Empty calories in the United States: definition and measurement.
Publication types
MeSH terms
Substances
Grants and funding
LinkOut - more resources
Full Text Sources
Medical
Research Materials
