. 2011 Sep 30;147(1):95-106.
doi: 10.1016/j.cell.2011.07.048.

Translocation-capture sequencing reveals the extent and nature of chromosomal rearrangements in B lymphocytes

Affiliations

Translocation-capture sequencing reveals the extent and nature of chromosomal rearrangements in B lymphocytes

Isaac A Klein et al. Cell. .

Abstract

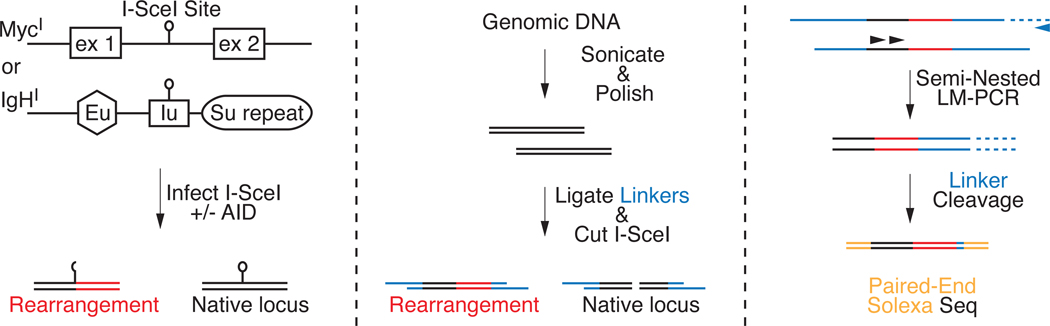
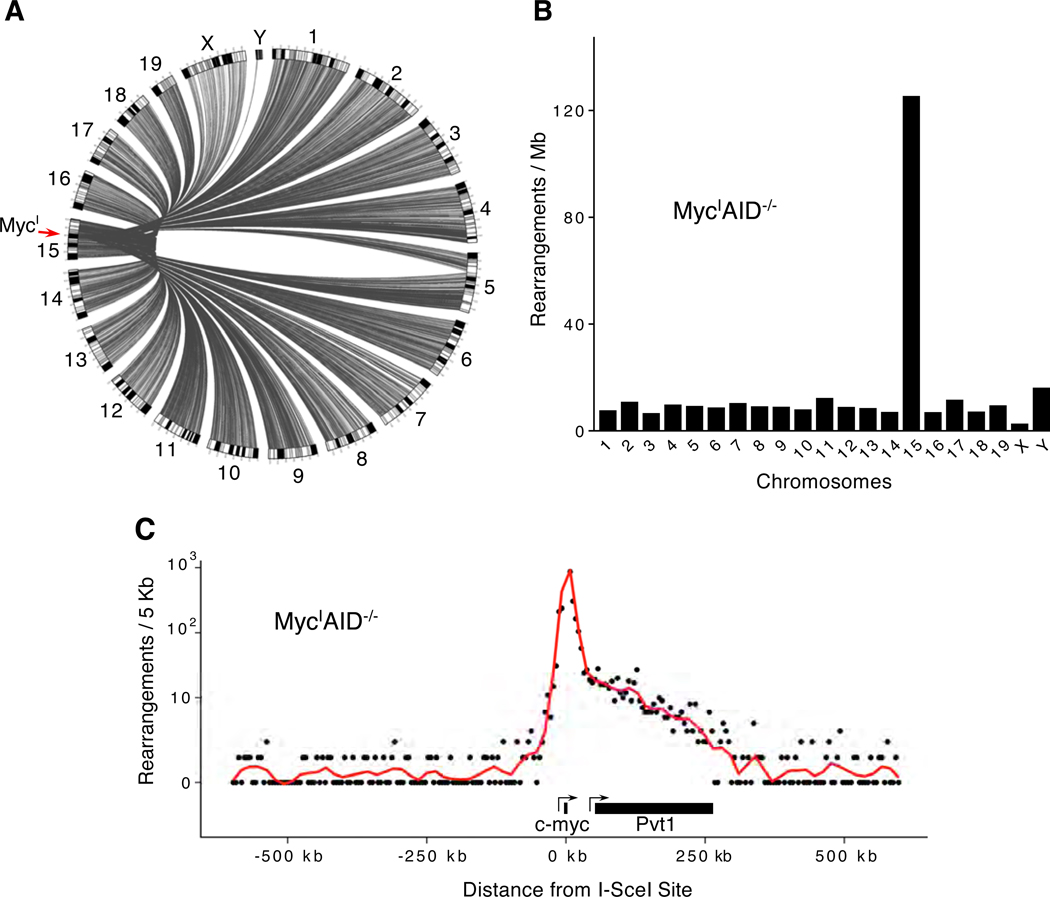
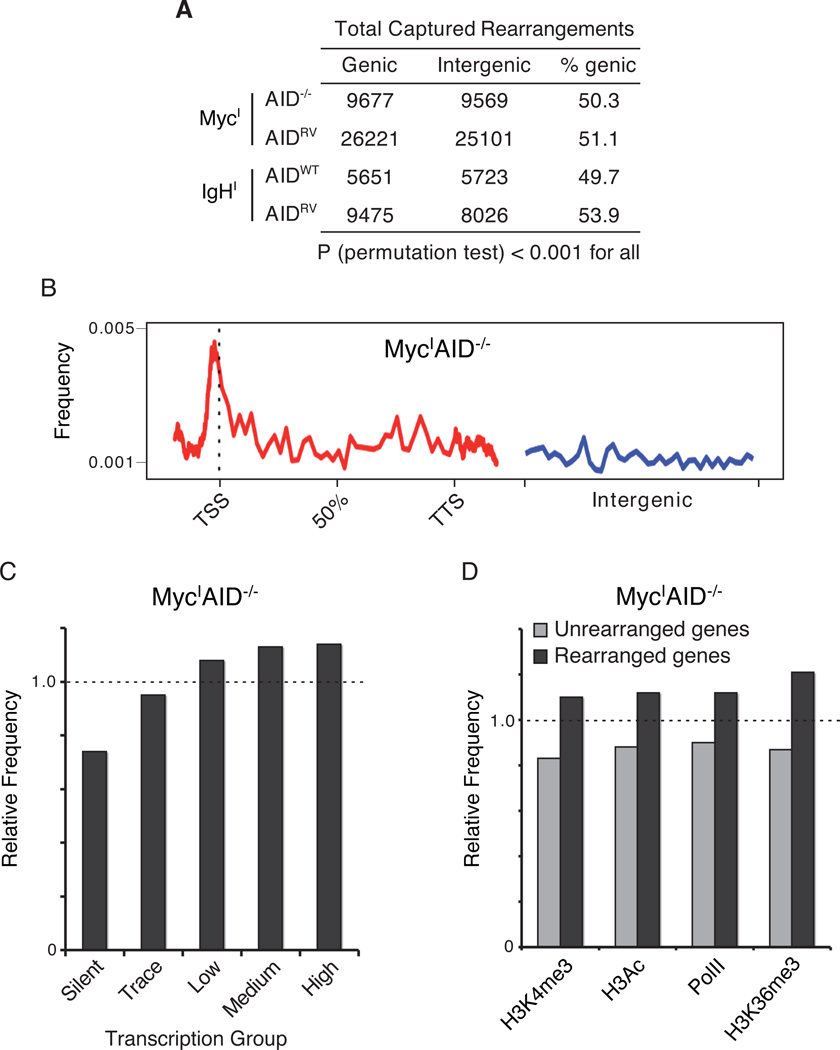
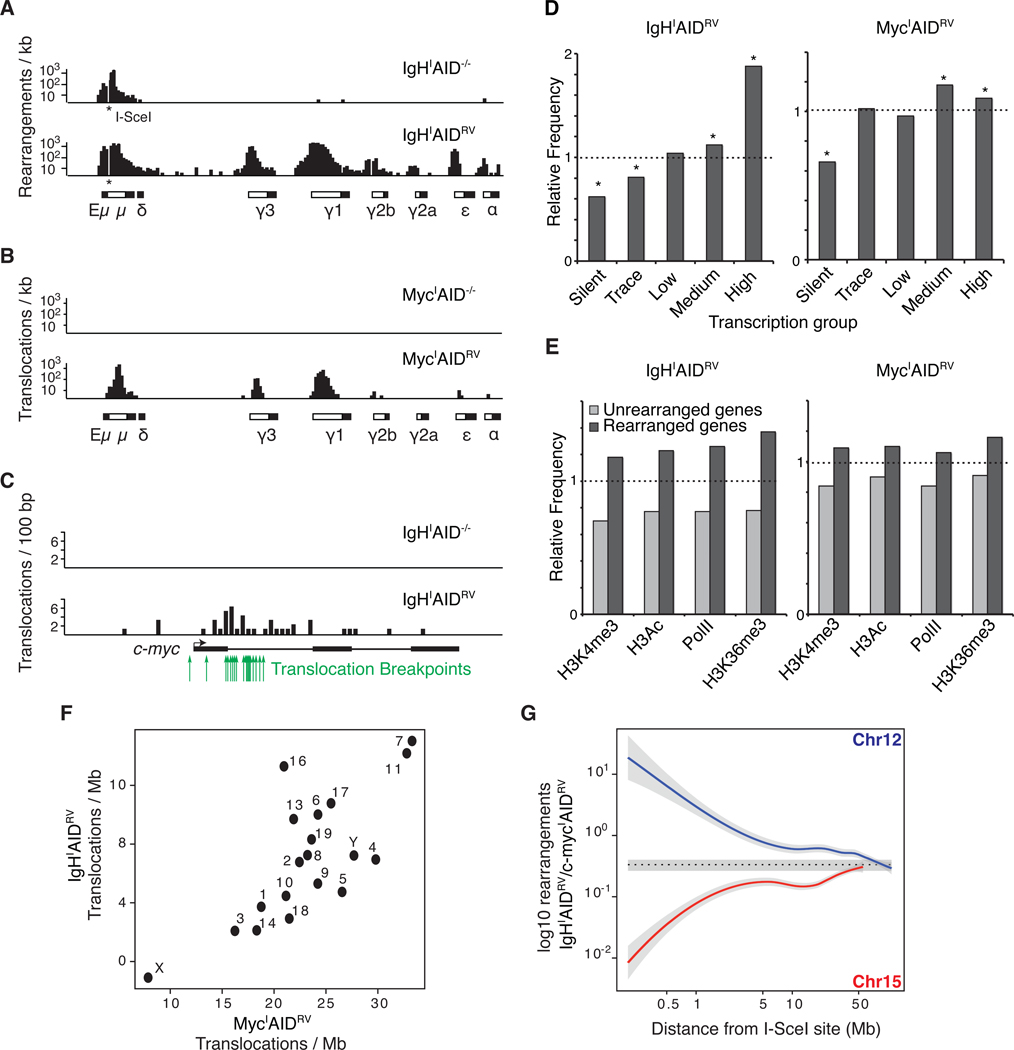
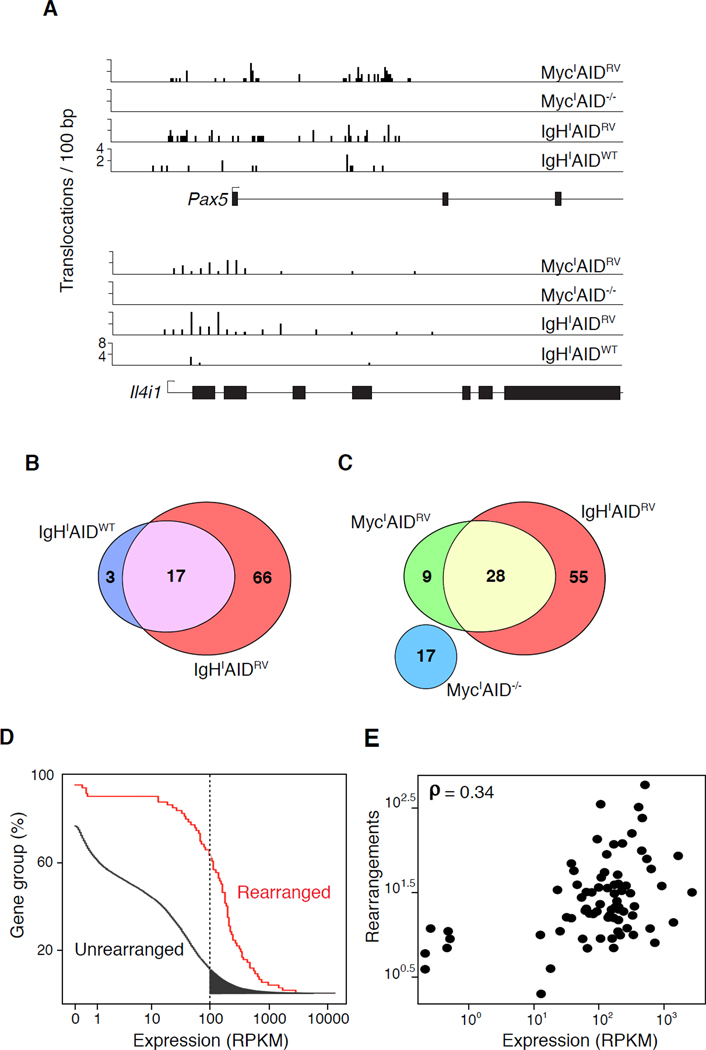
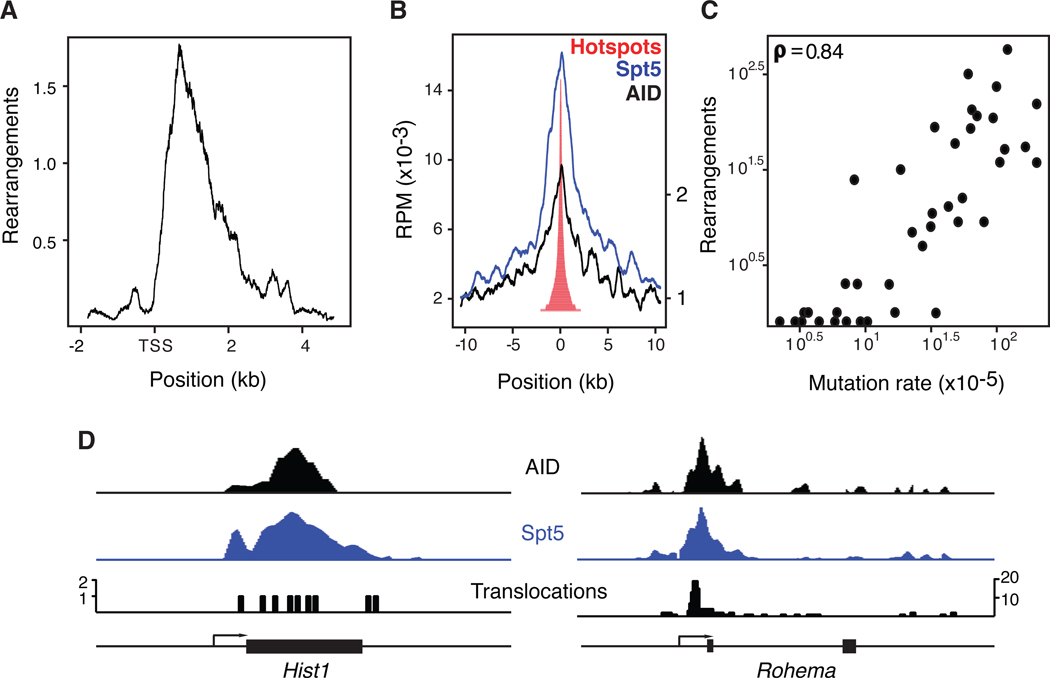
Chromosomal rearrangements, including translocations, require formation and joining of DNA double strand breaks (DSBs). These events disrupt the integrity of the genome and are frequently involved in producing leukemias, lymphomas and sarcomas. Despite the importance of these events, current understanding of their genesis is limited. To examine the origins of chromosomal rearrangements we developed Translocation Capture Sequencing (TC-Seq), a method to document chromosomal rearrangements genome-wide, in primary cells. We examined over 180,000 rearrangements obtained from 400 million B lymphocytes, revealing that proximity between DSBs, transcriptional activity and chromosome territories are key determinants of genome rearrangement. Specifically, rearrangements tend to occur in cis and to transcribed genes. Finally, we find that activation-induced cytidine deaminase (AID) induces the rearrangement of many genes found as translocation partners in mature B cell lymphoma.


Figures

Figure 1
Figure 1. TC-Seq schematic
IgHI or MycI primary B cells are infected with retroviruses encoding I-SceI with or without AID. Genomic DNA is fragmented, blunted, A-tailed, ligated to T-tailed asymmetric linkers and native loci are eliminated by I-SceI digestion. Rearrangements are amplified by semi-nested ligation-mediated PCR followed by linker cleavage and paired-end deep sequencing.
Figure 2
Figure 2. Rearrangements to a DSB site documented by TC-Seq
(A) Genome-wide view of rearrangements to MycI in AID−/− B cells. (B) Rearrangements per mappable megabase to each chromosome in MycIAID−/− B cells. (C) Profile of rearrangements around the I-SceI site in 5 kb intervals.
Figure 3
Figure 3. Rearrangements to MycI occur near the TSSs of actively transcribed genes
(A) Rearrangements, excluding the 1 Mb around I-SceI, were categorized as genic or intergenic. (B) Composite density profile of genomic rearrangements from MycI to genes (red line) and intergenic (blue line) regions. TSS = transcription start site, TTS = transcription termination site. (C) Relative frequency (fe) of rearrangements in genes that are either silent or display trace, low, medium or high levels of transcription in activated B cells as determined by RNA-Seq (Figure S1). Dashed line indicates the expected rearrangement frequency based on a random model. P < 0.001 for all (permutation test). (D) Relative frequency of rearrangements in PolII- and activating histone mark-associated gene groups (Yamane et al., 2011). Dashed line indicates expected frequency based on a random model. P < 0.001 for all samples (permutation test). Also see Figure S1.
Figure 4
Figure 4. Rearrangements to IgHI or MycI in primary B cells expressing AID
(A) Rearrangements per kb to I-SceI sites (indicated with an asterisk) in IgH or (B) c-myc in AID−/− (top panel) or AIDRV cells (bottom panel). White boxes in the schematics below each graph represent Ig switch domains while black boxes depict constant regions. (C) Translocations per 100 bp from IgHI to c-myc in AID−/− (top panel) or AIDRV cells (bottom panel). Green arrows indicate c-myc/IgH translocation breakpoints sequenced from primary B cells (Robbiani et al., 2008). (D) Relative frequency of rearrangements in transcription-level gene groups (Figure S1), dashed line indicates expected frequency based on a random model. Asterisks highlight values with a P < 0.001 (permutation test). (E) Relative frequency of rearrangements in PolII-associated or activating histone mark-associated gene groups (Yamane et al., 2011). Dashed line indicates the expected frequency based on a random model. P < 0.001 for all samples (permutation test). (F) Graph comparing the number of translocations per mappable megabase to each chromosome from IgHI (y axis) or MycI (x axis). (G) Ratio of IgHI captured to MycI captured events in 500 kb bins moving away from the I-SceI capture site (both directions combined). Dotted line represents the average trans-chromosomal joining rate computed on all chromosomes other than 12 or 15. Gray areas show 2 standard deviations around the mean. Also see Figure S2.
Figure 5
Figure 5. AID-dependent rearrangement hotspots
(A) Screenshots of translocations per 100 bp present at Il4i1 and Pax5 genes in all samples. (B) Overlap of AID-dependent hotspot-bearing genes in IgHIAIDRV and IgHIAIDWT experiments. (C) Overlap of AID-dependent hotspot-bearing genes in IgHIAIDRV, MycIAID−/− and MycIAIDRV experiments. (D) Empirical cumulative distribution showing transcript abundance in genes displaying (red) or lacking (black) rearrangement hotspots. Filled-in gray slice represents ~2000 highly transcribed unrearranged genes. (E) Total rearrangements as a function of gene expression (RNA-Seq) (Yamane et al., 2011) in genes bearing rearrangement hotspots. Also see Figure S3.
Figure 6
Figure 6. Characterization of AID-dependent hotspots
(A) Composite density graph showing the distribution of rearrangements in genes associated with AID-dependent hotspots relative to the TSS. (B) Spt5 and AID recruitment at genomic sites associated with translocation hotspots (Pavri et al., 2010; Yamane et al., 2011). (C) Somatic hypermutation frequency versus number of rearrangements in genes bearing AID-dependent translocation hotspots. (D) Distribution of AID, Spt5 and translocations in Rohema and Hist1 genes. Also see Figure S4.

Comment in

Similar articles

Cited by

References

    1. Aguilera A. The connection between transcription and genomic instability. EMBO J. 2002;21:195–201. - PMC - PubMed
    1. Argast GM, Stephens KM, Emond MJ, Monnat RJ., Jr I-PpoI and I-CreI homing site sequence degeneracy determined by random mutagenesis and sequential in vitro enrichment. J Mol Biol. 1998;280:345–353. - PubMed
    1. Bothmer A, Robbiani DF, Di Virgilio M, Bunting SF, Klein IA, Feldhahn N, Barlow J, Chen HT, Bosque D, Callen E, et al. Regulation of DNA End Joining, Resection, and Immunoglobulin Class Switch Recombination by 53BP1. Mol Cell. 2011;42:319–329. - PMC - PubMed
    1. Branzei D, Foiani M. Maintaining genome stability at the replication fork. Nat Rev Mol Cell Biol. 2010;11:208–219. - PubMed
    1. Campbell PJ, Stephens PJ, Pleasance ED, O'Meara S, Li H, Santarius T, Stebbings LA, Leroy C, Edkins S, Hardy C, et al. Identification of somatically acquired rearrangements in cancer using genome-wide massively parallel paired-end sequencing. Nat Genet. 2008;40:722–729. - PMC - PubMed

Publication types

Substances