. 2011 Sep 30;147(1):199-208.
doi: 10.1016/j.cell.2011.07.046.

Crystal structure of the mammalian GIRK2 K+ channel and gating regulation by G proteins, PIP2, and sodium

Affiliations

Crystal structure of the mammalian GIRK2 K+ channel and gating regulation by G proteins, PIP2, and sodium

Matthew R Whorton et al. Cell. .

Abstract

G protein-gated K(+) channels (Kir3.1-Kir3.4) control electrical excitability in many different cells. Among their functions relevant to human physiology and disease, they regulate the heart rate and govern a wide range of neuronal activities. Here, we present the first crystal structures of a G protein-gated K(+) channel. By comparing the wild-type structure to that of a constitutively active mutant, we identify a global conformational change through which G proteins could open a G loop gate in the cytoplasmic domain. The structures of both channels in the absence and presence of PIP(2) suggest that G proteins open only the G loop gate in the absence of PIP(2), but in the presence of PIP(2) the G loop gate and a second inner helix gate become coupled, so that both gates open. We also identify a strategically located Na(+) ion-binding site, which would allow intracellular Na(+) to modulate GIRK channel activity. These data provide a structural basis for understanding multiligand regulation of GIRK channel gating.


Figures

Figure 1
Figure 1. Structure and function of the GIRK2 channel
(A) Cartoon diagram of the GIRK2 structure. Each subunit of the tetramer is a different color. Unmodeled segments of the turret and N-terminal linker are drawn with dashed lines. The approximate boundary of the phospholipid bilayer is indicated by the thick black lines. (B) A cartoon diagram of key residues that mediate the contacts at the interface between the cytoplasmic and transmembrane domains. The same coloring scheme as in panel A is used. (C) Representative example of a two-electrode voltage-clamp recording from Xenopus laevis oocytes expressing the truncated GIRK2 construct used for crystallography, held at −80 mV. The white bar indicates a physiological extracellular solution containing 96 mM NaCl and 2 mM KCl, whereas the gray bars represent a solution of 98 mM KCl only. The application of 10 μM acetylcholine (ACh) or 1 μM tertiapin-Q (TPN-Q) is also indicated. The dashed line represents zero current – all traces under this line represent negative, inward currents. (D) Voltage ramps of oocytes expressing the same truncated GIRK2 construct. Currents were measured using two-electrode voltage clamp with an extracellular solution of 98 mM KCl, in the presence of 1 μM ACh (total current, red) or 1 μM ACh + 100 nM TPN-Q (background current, green). GIRK2-specific current (total minus background) is shown as the blue trace. The inset graph is the same data, but with a different scale for the axes to illustrate the degree of rectification. See also Figure S1 and Table S1.
Figure 2
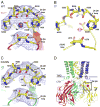
Figure 2. The Na+ binding site in GIRK2 is located between the βC-βD and βE-βG loops and is dependent on the negatively charged residue Asp228
(A) The key side chain and main chain atoms involved in coordinating a Na+ ion (purple sphere) are shown. A weighted 2Fo-Fc Na+-omit electron density map is shown as a blue mesh, contoured at 1.2 σ. (B) A Tl+ anomalous difference electron density map is shown at the same site, contoured at 4 σ (magenta mesh). The data are derived from WT GIRK2 crystals grown in KNO3 and then soaked in TlNO3, all in the absence of any Na+. (C) The same site is shown for the structure of a D228N mutant. Electron density is also shown at the same contour level as for wild-type, showing the lack of density for Na+. (D) A model of the whole channel is shown. Each subunit is a different color with the front subunit removed for clarity. The Na+ ions are again depicted as purple spheres to show their location relative to the whole channel. The region of the channel shown in panels A-C is highlighted by the black box. See also Figure S2.
Figure 3
Figure 3. The R201A mutant is constitutively active, which is partially the result of a rearrangement of the βC-βD loop and a widening of the G loop gate
(A) A summary of oocyte currents from two-electrode voltage clamp experiments for various GIRK2 mutants. The experiments were performed the same as in Figure 1C. Mutations were selected based on the interactions shown in Figure 1B. Specific GIRK2 current (gray bars) is evaluated as the total ACh-stimulated current minus the remaining current after TPN-Q blockage. Fraction ACh stimulation (black bars) is evaluated as the ACh-stimulated current (the difference in the current before and after the addition of ACh) divided by the total GIRK2-specific current. (*) All currents were measured 16–24 hrs after RNA injection, except for Y78L and R201A, which did not show appreciable current until after 3 days of expression. All RNAs were injected undiluted, except for the D228N mutant, which was diluted 10-fold. Error bars represent the standard deviation of the mean from 3 different oocytes for each mutant. Data are not shown for the following mutants that did not show any detectable currents: D81Y/N/R/A/E, Y78D/A, R230D/K/A, R201K/D/Q, D228R/E/A, R201D/D228D, R230D/D81R, D81Y/Y78D. (B) Representative example of a two-electrode voltage-clamp recording of Xenopus laevis oocytes expressing the R201A GIRK mutant. The experiment was performed exactly as in Figure 1C. (C) A comparison of the wild-type (red with orange side chains) and R201A mutant structures (green). (D and E) A comparison of the conformation of the G loop gate between the wild-type (red, D) and R201A (green, E) structures. The top panels are a cross-section of the channel, showing the G loops of just two opposing subunits. Key residues that form the main constriction in the ion conduction pathway are highlighted (there was no electron density for M319 in (E), so it was modeled as alanine). The bottom panels show a top-down view of the cytoplasmic domain tetramer with the side chains that were highlighted in the top panels shown as space-filling models.
Figure 4
Figure 4. The R201A mutant shows a propagated conformational change through the cytoplasmic domain that mimics the same changes induced by G proteins
A comparison of the conformational changes over the whole channel between the wild-type (red) and the R201A mutant (green) structures. The front subunit has been removed for clarity. The intensity of the color is related to the absolute conformational change between identical residues (a combination of the distance between both the alpha and gamma carbons of the two structures, to account for both main-chain and rotamer conformational changes). The large deviations in the transmembrane domain arise from a slight rigid-body twist of the cytoplasmic domain relative to the transmembrane domain. The close-up view on the right highlights key side chains involved in propagating the conformational change through the channel. Important ligand-binding sites are identified by blue circles. See also Figure S3 and Movie S1.
Figure 5
Figure 5. PIP2 binds at the interface between the transmembrane and cytoplasmic domains, and is coordinated by several positively charged residues
PIP2 molecules are colored yellow, orange, and red (for carbon, phosphorus, and oxygen atoms) and are shown in the context of the whole channel (gray) on the left, and a closeup view on the right. The thick black lines indicate the approximate boundary of the plasma membrane and the black box highlights the region of the close-up view on the right. On the right, the main coordinating residues are shown as sticks. Residues Lys90 and Arg92 were modeled as alanines due to a lack of electron density, but probably still contribute to the positive electrostatics of the binding site. The important gating residue Phe192 is also shown for reference. See also Figure S4.
Figure 6
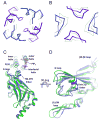
Figure 6. PIP2 binding to the R201A mutant causes the inner helix and G loop gates to open
(A) The inner helix gate is shown as a Cα-trace for the apo structure of R201A (thin, green ribbons) and the structure of the R201A mutant with PIP2 (thick, blue and purple ribbons). The side chain of Phe192 is also shown. For the R201A + PIP2 structure, the subunits that bound PIP2 are shown in blue, whereas the PIP2-free subunits are shown in purple. (B) The same coloring scheme is used as in panel A, except now the G loop gate is highlighted. (C) One subunit of R201A + PIP2 is shown (blue) compared to the apo structure of R201A (green). The residues for the βL-βM loop are hidden to more clearly show the rigid-body twisting of the cytoplasmic domain. The PIP2 molecule is shown in ball and stick representation. (D) A top down, orthogonal view of panel C. Only the cytoplasmic domain is shown to more clearly show the rigid-body twisting. See also Figures S3 and S5, and Movie S2
Figure 7
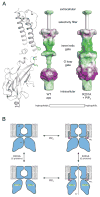
Figure 7. The R201A mutant in the presence of PIP2 creates a continuous cavity from the cytoplasm to the selectivity filter large enough for a hydrated K+ ion
(A) Surface representations for the interior surfaces of the wild-type apo (left) vs. a four-fold symmetrical model of R201A + PIP2 (right). The K+-accessible space was determined with the HOLLOW script (Ho and Gruswitz, 2008). The R201A + PIP2 model was generated by rotating the PIP2-bound subunits 90 degrees about the central tetrameric axis. The surface of the cavities are colored according to the hydrophobicity of the surrounding side chains. For reference, a cartoon representation of the channel is shown on the far left. The key residues of the inner helix (Phe192) and G loop gates (Met313 and Met319) are shown in cyan. (B) A schematic model depicting the effects that PIP2 and the R201A mutation have on GIRK2 channels. The three main constriction points are labeled in the top-left panel: a. selectivity filter, b. inner helix gate, c. G loop gate. PIP2 binding to the wild type channel opens the inner helix gate slightly, but the G loop gate is still closed (top right). The R201A mutant induces a series of conformational changes that mimic the effect of G protein binding – this results in the opening of the G loop gate, but the inner helix gate is still closed (bottom left). The combination of the R201A mutant and PIP2 causes a rotation of the CTD, which in turn splays apart the inner helix gate and further opens the G loop gate (bottom right). The net effect of these conformational changes is an open channel. See also Figure S6.

References

    1. Boudker O, Ryan RM, Yernool D, Shimamoto K, Gouaux E. Coupling substrate and ion binding to extracellular gate of a sodium-dependent aspartate transporter. Nature. 2007;445:387–393. - PubMed
    1. Choi M, Scholl UI, Yue P, Bjorklund P, Zhao B, Nelson-Williams C, Ji W, Cho Y, Patel A, Men CJ, et al. K+ channel mutations in adrenal aldosterone-producing adenomas and hereditary hypertension. Science. 2011;331:768–772. - PMC - PubMed
    1. Clarke OB, Caputo AT, Hill AP, Vandenberg JI, Smith BJ, Gulbis JM. Domain reorientation and rotation of an intracellular assembly regulate conduction in Kir potassium channels. Cell. 2010;141:1018–1029. - PubMed
    1. Decher N, Renigunta V, Zuzarte M, Soom M, Heinemann SH, Timothy KW, Keating MT, Daut J, Sanguinetti MC, Splawski I. Impaired interaction between the slide helix and the C-terminus of Kir2.1: a novel mechanism of Andersen syndrome. Cardiovasc Res. 2007;75:748–757. - PubMed
    1. Donaldson MR, Jensen JL, Tristani-Firouzi M, Tawil R, Bendahhou S, Suarez WA, Cobo AM, Poza JJ, Behr E, Wagstaff J, et al. PIP2 binding residues of Kir2.1 are common targets of mutations causing Andersen syndrome. Neurology. 2003;60:1811–1816. - PubMed

Publication types

Substances