. 2011 Oct 18;21(4):708-21.
doi: 10.1016/j.devcel.2011.08.019. Epub 2011 Sep 29.

The tetraspanin CD63 regulates ESCRT-independent and -dependent endosomal sorting during melanogenesis

Affiliations

The tetraspanin CD63 regulates ESCRT-independent and -dependent endosomal sorting during melanogenesis

Guillaume van Niel et al. Dev Cell. .

Abstract

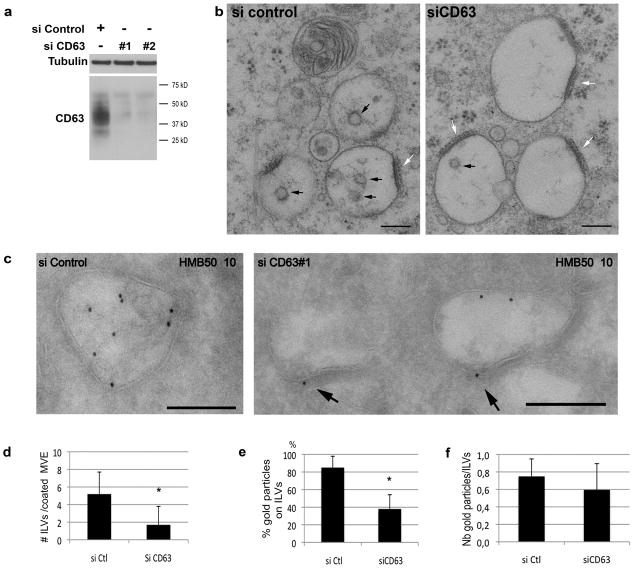
Cargo sorting to intraluminal vesicles (ILVs) of multivesicular endosomes is required for lysosome-related organelle (LRO) biogenesis. PMEL-a component of melanocyte LROs (melanosomes)-is sorted to ILVs in an ESCRT-independent manner, where it is proteolytically processed and assembled into functional amyloid fibrils during melanosome maturation. Here we show that the tetraspanin CD63 directly participates in ESCRT-independent sorting of the PMEL luminal domain, but not of traditional ESCRT-dependent cargoes, to ILVs. Inactivating CD63 in cell culture or in mice impairs amyloidogenesis and downstream melanosome morphogenesis. Whereas CD63 is required for normal PMEL luminal domain sorting, the disposal of the remaining PMEL transmembrane fragment requires functional ESCRTs but not CD63. In the absence of CD63, the PMEL luminal domain follows this fragment and is targeted for ESCRT-dependent degradation. Our data thus reveal a tight interplay regulated by CD63 between two distinct endosomal ILV sorting processes for a single cargo during LRO biogenesis.


Conflict of interest statement

Competing financial interests

The authors declare no competing financial interests.

Figures

Figure 1
Figure 1. CD63 co-localizes with PMEL on ILVs of MVEs from human melanocytic cells
a. MNT-1 cells were analyzed by IFM after labeling for CD63 and for PMEL using antibody HMB50 (detects the luminal domain). Individual labels, a merged image, and a 3-fold magnification of the merged image are shown. Note that labeling for CD63 and PMEL luminal domain partially overlap. Scale bar, 10 μm. b-d. MNT-1 cells were processed for ultrathin cryosectioning and double immunogold labeled for PMEL luminal domain (HMB50; PAG 15) and CD63 (PAG 10). b. PMEL and CD63 are both present in MVEs (annoted MVE on the micrograph) whereas only CD63 is observed on maturing melanosomes (annoted IV on the micrograph). Scale bar, 200 nm. c. Quantification of immunogold labeling for PMEL (using HMB50 antibody) and CD63. An equivalent number of gold particles representing labeling for PMEL and for CD63 in the EM analysis was counted and assigned to the indicated compartments, which were identified by morphology. Data are presented as the mean percentage of total gold particles in each compartment +/− SD. d. Quantification of immunogold labeling on ILVs vs. the limiting membrane on coated MVEs. Results are expressed as the mean percentage of gold particles (+/− SD) on ILVs (see b left panel for an example) relative to total gold particles counted in MVEs.
Figure 2
Figure 2. Depletion of CD63 inhibits sorting of PMEL onto ILVs
a. Western blot analysis of lysates of MNT-1 cells treated with control or 2 different CD63 siRNA using anti-CD63 antibody and anti-β-tubulin antibody as a loading control. b. MNT-1 cells treated with control or CD63 siRNA #1 were analyzed by conventional EM. Black arrows indicate the ILVs; white arrows indicate the cytosolic bilayered coats. Scale bar, 200 nm. c. Ultrathin cryosections of MNT-1 cells treated with control (left panel) or CD63#1 siRNA (right panel) were immunogold labeled for PMEL luminal domain with HMB50 and PAG10. Examples of MVEs from each sample are shown. Whereas in control cells labeling for PMEL luminal domain is associated with the ILVs, in CD63 depleted cells the labeling is observed at the limiting membrane of the endosome close or within the clathrin coat (arrows). Scale bar, 200 nm. d. The average number of ILVs (+/− SD) per coated MVE in 50 conventional EM profiles of each sample was quantified. *, p<0.05. e. Quantification of immunogold labeling for PMEL on ILVs of 100 MVEs is expressed as the mean percentage of gold particles (+/− SD) on ILVs relative to total gold particles in MVEs. *, p<0.05. f. Same as e., but results are expressed as the mean number of gold particles (+/− SD) per ILV within MVEs.
Figure 3
Figure 3. Depletion of CD63 inhibits formation of PMEL fibrils in vitro and in vivo
a. Triton X-100-insoluble fraction from MNT-1 cells treated with control or 2 different CD63 siRNA (CD63#1 and CD63#2) were analyed by western blot using HMB45 or β-tubulin antibody as a loading control. The percentage of signal intensity relative to the control is noted below each band. b, c. MNT-1 cells treated with the CD63#1 siRNA were analyzed by IFM after labeling for CD63 and HMB45 (b) or HMB50 (c). CD63-inactivated cells are indicated by white stars; the micrographs were choosen to better emphasize the differences between CD63-inactivated cells and CD63-expressing cells. Scale bar, 10 μm d. MNT-1 cells treated with control or CD63#1 siRNA were analyzed by conventional EM. Arrows, bilayered coats on MVEs; arrowheads, maturing melanosomes (stage II and III). Scale bar, 200 nm. e. Representative images of (1) stage II pre-melanosomes in control cells, and (2) dense unstructured aggregates or (3) lysosomes in CD63-depleted cells. Scale bar, 200 nm. f. Quantification of the number of different endosomal/melanosomal compartments, as indicated on the X axis and defined by morphology, observed by conventional EM in MNT-1 cells treated with control and CD63 siRNA. Values represent the percentage of each compartment relative to all of the endosomal/melanosomal compartments identified in 50 cell profiles per condition. Note that “total MVEs” refers to all compartments with internal vesicles within their lumen, whereas “coated MVEs” refers only to early endosomes/stage I melanosomes with a coat on the cytosolic side whatever the number of internal vesicles within their lumen. g. Eyes sections from CD63+/+ (top panel) and CD63−/− mice (bottom panel) were analyzed by conventional EM. Shown are regions of the RPE and photoreceptor outer segments (OS). Note the ellipsoidal melanosomes in RPE of CD63+/+ mice, and the electron dense rounder structures (arrows) in the RPE of CD63−/− mice. Scale bars are indicated on each micrograph.
Figure 4
Figure 4. Depletion of CD63 affects the processing of PMEL
a. Schematic representation of PMEL maturation and the epitopes recognized by the antibodies used in this study. The maturation process is described in the text. Black triangles, mature N- and O-linked glycosylation; black bar, a disulfide bond that links Ma and Mb; PC, proprotein convertase; ?, unknown proteases that cleave Mα to MαC; ICD, intracellular domain of CTF. The names of the anti-PMEL antibodies used in this study and the isoforms they recognize are indicated. b. Whole cell lysates of MNT-1 cells treated with control or CD63 siRNA #1 or #2 were analyzed by western blot using αPmel-C antibody. The percentage of signal intensity relative to the control is noted above each band. c. Whole cell lysates of MNT-1 cells treated with control or CD63 siRNA#1 and with 1μM DAPT for 4hrs were analyzed by western blot using αPmel-C antibody. d, e, f. Triton X-100- soluble (Tx sol) and -insoluble (Tx insol) lysates of MNT-1 cells treated with control or CD63 siRNA#1 were analyzed by western blot using αPmel-C (d), αPmel-N (e) or I51 antibody (f).
Figure 5
Figure 5. CD63 interacts with PMEL CTF
a. HeLa cells that were mock transfected (left panel) or transfected with PMEL expression vector (right) were lysed in buffer containing 1% Brij97, and lysates were immunoprecipitated with antibodies to CD63, CD81, or PMEL (with αPmel-C) as indicated. Immunoprecipitates or untreated lysate (Ext) were analyzed by western blot with αPmel-C (top panels) or anti-CD63 antibody (bottom panels). b. Lysates of MNT-1 cells that were treated for 24 hrs with 1 μM DAPT and lysed with 1% Brij97 were immunoprecipitated with antibodies to TSPANs CD9, CD81, CD63 or CD55, to MART-1, or to PMEL using αPmel-C, HMB45 or HMB50. Immunoprecipitates or untreated lysate (Ext) were fractionated by reducing (top 2 panels) or non-reducing (bottom 2 panels) SDS-PAGE and analyzed by immunoblot with αPmel-C, anti-MART-1, anti-CD63 or anti-CD81.
Figure 6
Figure 6. The PMEL CTF is excluded from melanosomes and degraded in an ESCRT-I dependent manner
a. MNT-1 cells treated with control or Tsg101 siRNA were analyzed by western blot using antibodies to β-tubulin, Tsg101, MART-1, or the anti-PMEL antibodies HMB45 and αPmel-C. Only relevant bands are shown. b. MNT-1 cells treated with control or Tsg101 siRNA were analyzed by IFM after labeling for HMB45 (red) and αPmel-C (green). White arrows indicate accumulation of αPmel-C labeling around HMB45 positive spots. Individual labels, a merged image, and a 3X magnification of the merged images are shown. Scale bar, 10 μm c–f. MNT-1 cells were treated with DMSO or 1 μM DAPT for 4hrs. c. Cells were analyzed by IFM after labeling with HMB50 (red) and αPmel-C (green). Scale bar, 10 μm d. Ultrathin cryosections were immunogold labeled with HMB50 (PAG 15, arrows) and αPmel-C (PAG10, arrowheads) and analyzed by IEM. After treatment with DAPT, note the αPmel-C labeling on endo-lysosomal structures and vesicles rather than at the limiting membrane of the PMEL luminal domain-positive compartment. Scale bar, 200 nm. e. Cells were analyzed by conventional EM. Note the presence of the clathrin coats (black arrowheads) and MVEs (white arrow). Scale bar, 200 nm. f. Ultrathin cryosections were immunogold labeled for αPmel-C (PAG10 indicated by arrowheads). Note the presence of αPmel-C labeling at the limiting membrane of a clathrin coated MVE. Scale bar, 200 nm. g. MNT-1 cells were treated for 24 hrs with DMSO or 1 μM DAPT, and then lysed in buffer containing 1% Brij97. Lysates were immunoprecipitated with anti-MART-1 or anti-PMEL antibodies αPmel-C, HMB45, or HMB50, and immunoprecipitates or untreated lysate (Ext) were analyzed by immunoblot with an anti-ubiquitin antibody. Note the enrichment of ubiquitin signal in eluates from αPmel-C antibody immunoprecipitation after DAPT treatment.
Figure 7
Figure 7. PMEL luminal domain is degraded in a ESCRT dependent manner in CD63 depleted cells
a. Quantification of immunogold labeling for PMEL luminal domain (HMB50) in different compartments on ultrathin cryosections of MNT-1 cells treated control or CD63#1 siRNA. Results are expressed as percentage (%) of total immunogold labeling in each compartments. b, left panel: MNT-1 cells treated with CD63#1 siRNA were analyzed by conventional EM. note the presence of MVEs (arrows) devoid of coats in the vicinity of coated vacuoles (arrowhead). Bar: 200nm. Right panel: Ultrathin cryosections of MNT-1 cells treated with CD63#1 siRNA were immunogold labeled with HMB50 (PAG 10, arrows) and Hrs (PAG5, arrowheads) and analyzed by IEM. Note the HMB50 labeling on endo-lysosomal structures rather than in Hrs positive compartment. Scale bar, 200 nm. c. Representative micrographs of coated endosomes. Arrows indicate the characteristic bilayered coats that are expanded upon CD63 inactivation. Scale bar, 200 nm. d. Shown are the percentage (%) of coated endosomes relative to the total number of MVEs (left panel) and the mean length of the coat (right panel) measured on 50 profiles from each condition. *=P<0.01, §= P<0.05. e. Whole cell lysates of MNT-1 cells treated with control siRNA or CD63#1 siRNA alone or together with siRNA to Tsg101 were analyzed by western blot using antibodies to CD63, Tsg101, MART-1, or β-tubulin, or anti-PMEL antibodies αPmel-C, HMB45, or αPmel-N. Relevant bands are indicated. f. Ultrathin cryosections of MNT-1 cells treated with CD63 and Tsg101 siRNA were immunogold labeled with alphaPmel-C (PAG 10, arrowheads) and HMB50 (PAG5, arrows) and analyzed by IEM. Note that both labeling are broadly localized to the limiting membrane. Scale bar, 200 nm.

References

    1. Abache T, Le Naour F, Planchon S, Harper F, Boucheix C, Rubinstein E. The transferrin receptor and the tetraspanin web molecules CD9, CD81, and CD9P-1 are differentially sorted into exosomes after TPA treatment of K562 cells. J Cell Biochem. 2007;102:650–664. - PubMed
    1. Berson JF, Harper DC, Tenza D, Raposo G, Marks MS. Pmel17 initiates premelanosome morphogenesis within multivesicular bodies. Mol Biol Cell. 2001;12:3451–3464. - PMC - PubMed
    1. Berson JF, Theos AC, Harper DC, Tenza D, Raposo G, Marks MS. Proprotein convertase cleavage liberates a fibrillogenic fragment of a resident glycoprotein to initiate melanosome biogenesis. J Cell Biol. 2003;161:521–533. - PMC - PubMed
    1. Buschow SI, Nolte-‘t Hoen EN, van Niel G, Pols MS, ten Broeke T, Lauwen M, Ossendorp F, Melief CJ, Raposo G, Wubbolts R, et al. MHC II in dendritic cells is targeted to lysosomes or T cell-induced exosomes via distinct multivesicular body pathways. Traffic. 2009;10:1528–1542. - PubMed
    1. Charrin S, le Naour F, Silvie O, Milhiet PE, Boucheix C, Rubinstein E. Lateral organization of membrane proteins: tetraspanins spin their web. Biochem J. 2009;420:133–154. - PubMed

Publication types