

Active leukocyte detachment and apoptosis/necrosis on PEG hydrogels and the implication in the host inflammatory response
- PMID: 21963150
- PMCID: PMC3281311
- DOI: 10.1016/j.biomaterials.2011.09.044
Active leukocyte detachment and apoptosis/necrosis on PEG hydrogels and the implication in the host inflammatory response
Abstract
Monocytes/Macrophages have long been recognized as key players in inflammation and wound healing and are often employed in vitro to gain an understanding of the inflammatory response to biomaterials. Previous work has demonstrated a drastic decrease in primary monocyte adherent density on biomaterial surfaces coupled with a change in monocyte behavior over time. However, the mechanism responsible for this decrease remains unclear. In this study, we explored active detachment and cellular death as possible regulating factors. Specifically, extracellular TNF-α and ROS production were analyzed as potential endogenous stimulators of cell death. MMPs, but not calpains, were found to play a key role in active monocyte detachment. Monocyte death was found to peak at 24 h and occur by both apoptosis and necrosis as opposed to polymorphonuclear leukocyte death which mainly occurred through apoptosis. Finally, TNF-α and ROS production were not found to have a causal relationship with monocyte death on TCPS or PEG surfaces. The occurrence of primary monocyte apoptosis/necrosis as well as active detachment from a material surface has implications not only in in vitro study, but also in the translation of the in vitro inflammatory response of these cells to in vivo applications.
Copyright © 2011 Elsevier Ltd. All rights reserved.
Figures
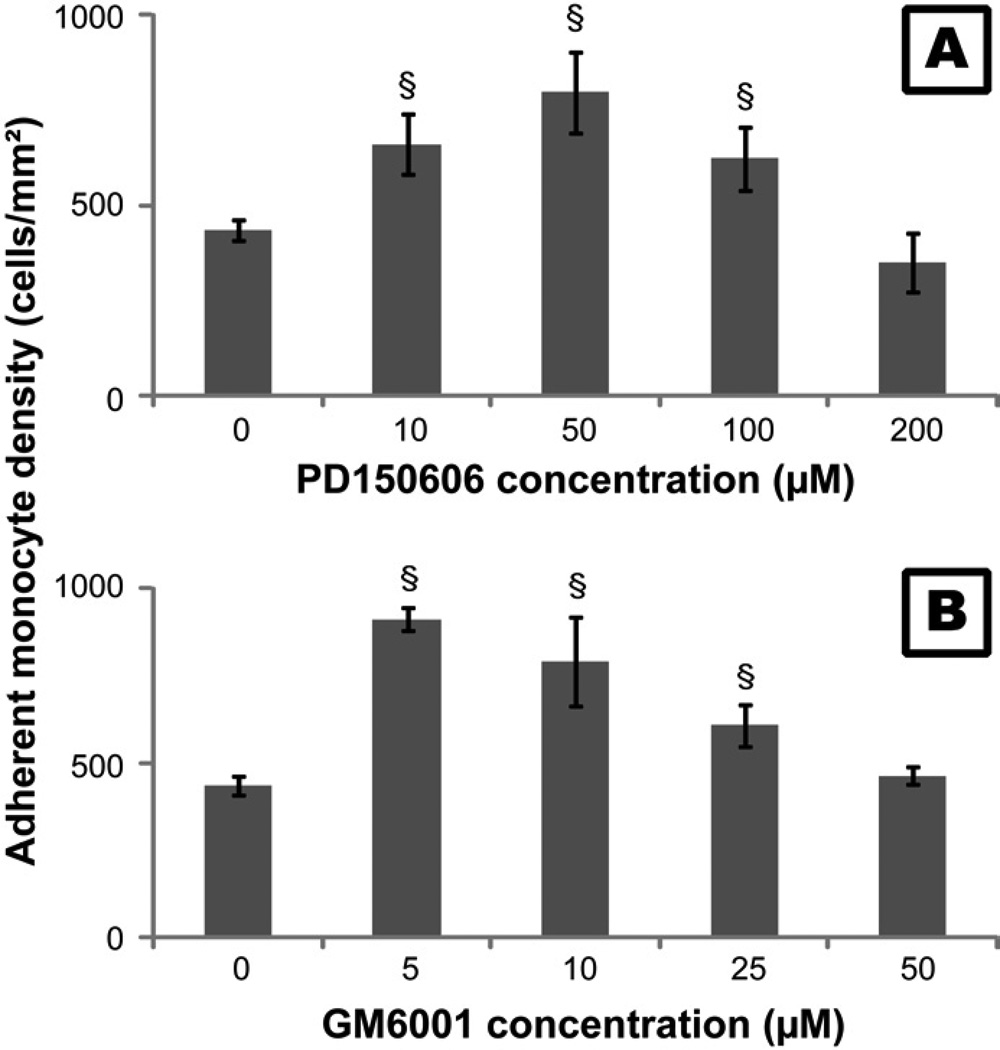
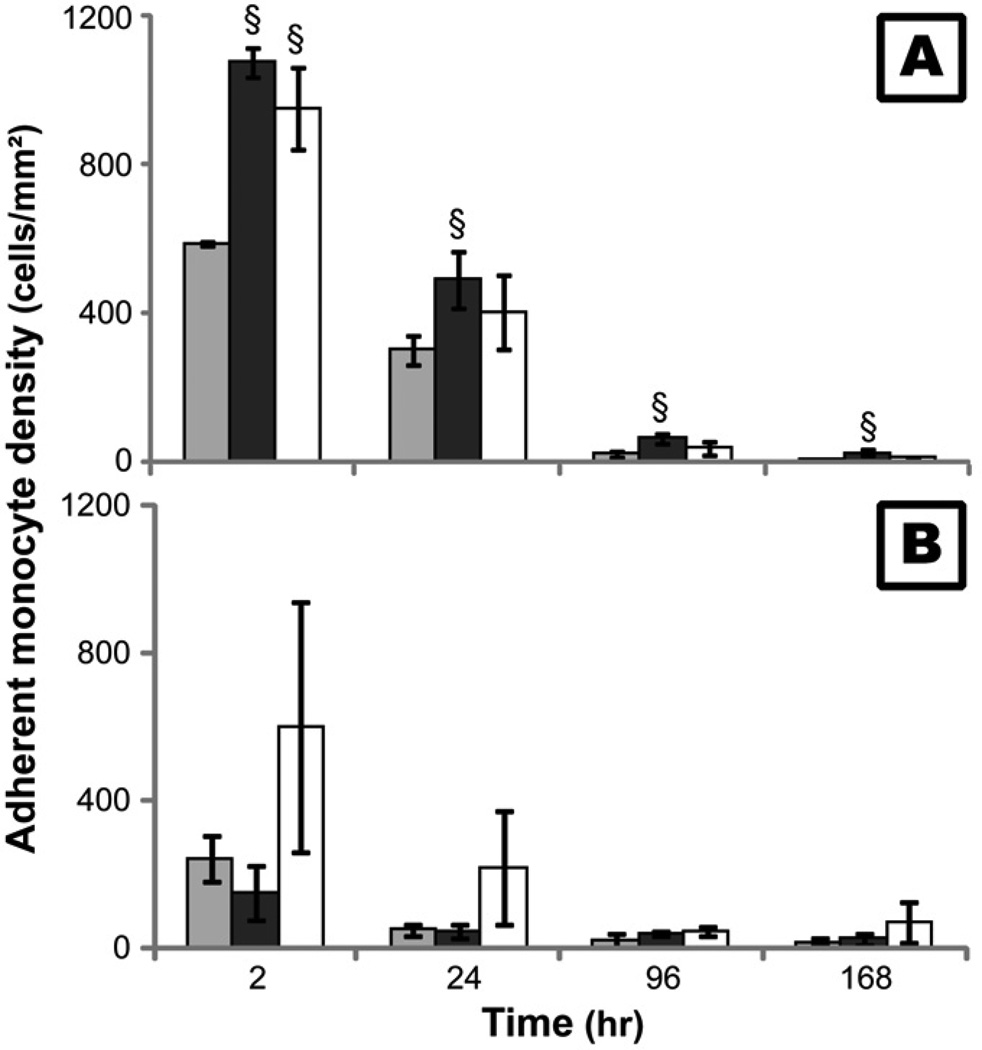
 ) or 50µM PD150606 (
 ) before each time point. Cells cultured without GM6001 or PD150606 served as control (
 ). §: significantly different compared to the control without additive at the same time point, p<0.05;
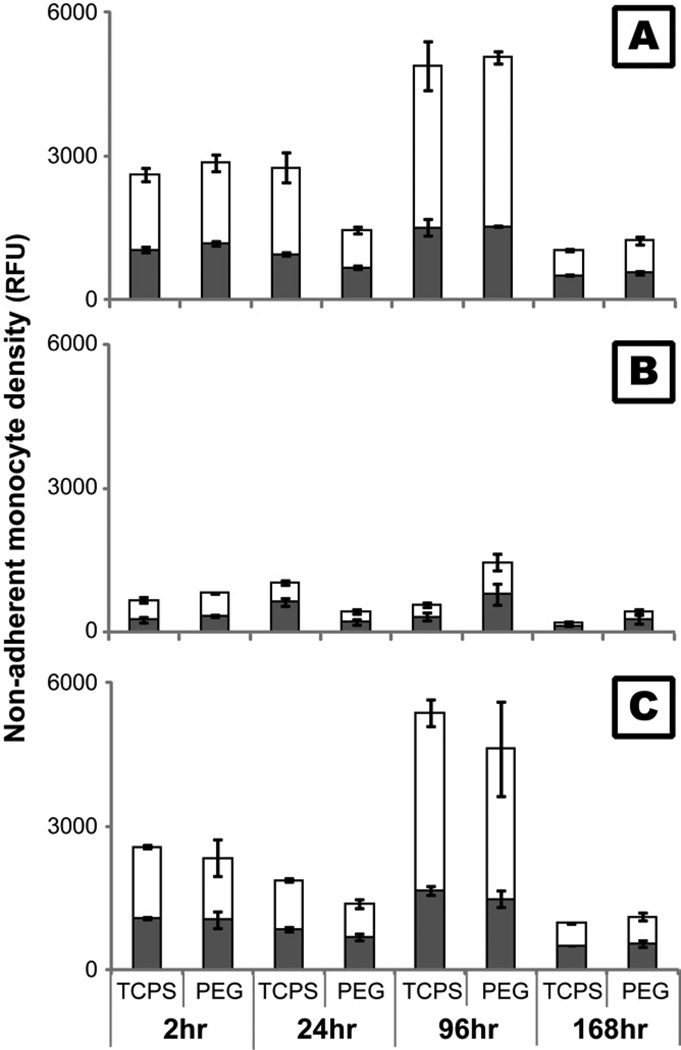
 ) and non-viable () monocytes in the cell culture supernatant after treatment with 10µM GM6001 (B) or 50µM PD150606 (C) for 2 hours before each time point on TCPS and PEG hydrogel substrates. The fluorescence of live and dead cells was measured for each sample simultaneously (MultiTox-Fluor™, Promega). Cells cultured on TCPS without GM6001 or PD150606 served as control (A).
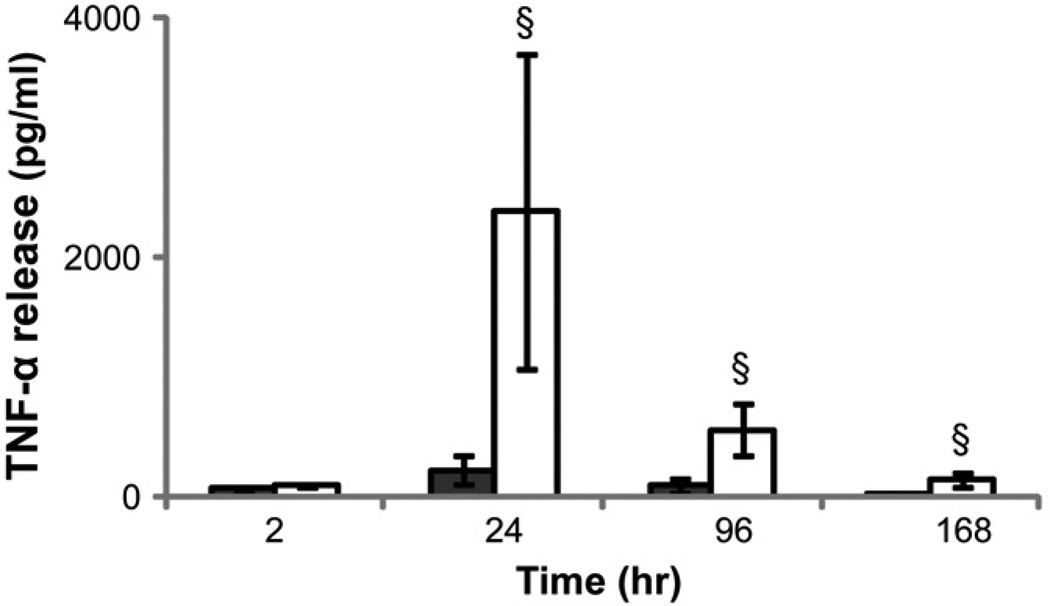
 )and PEG hydrogel () substrates at 2, 24, 96 and 168 hours. §: significantly different compared to TCPS at the same time point, p<0.05;
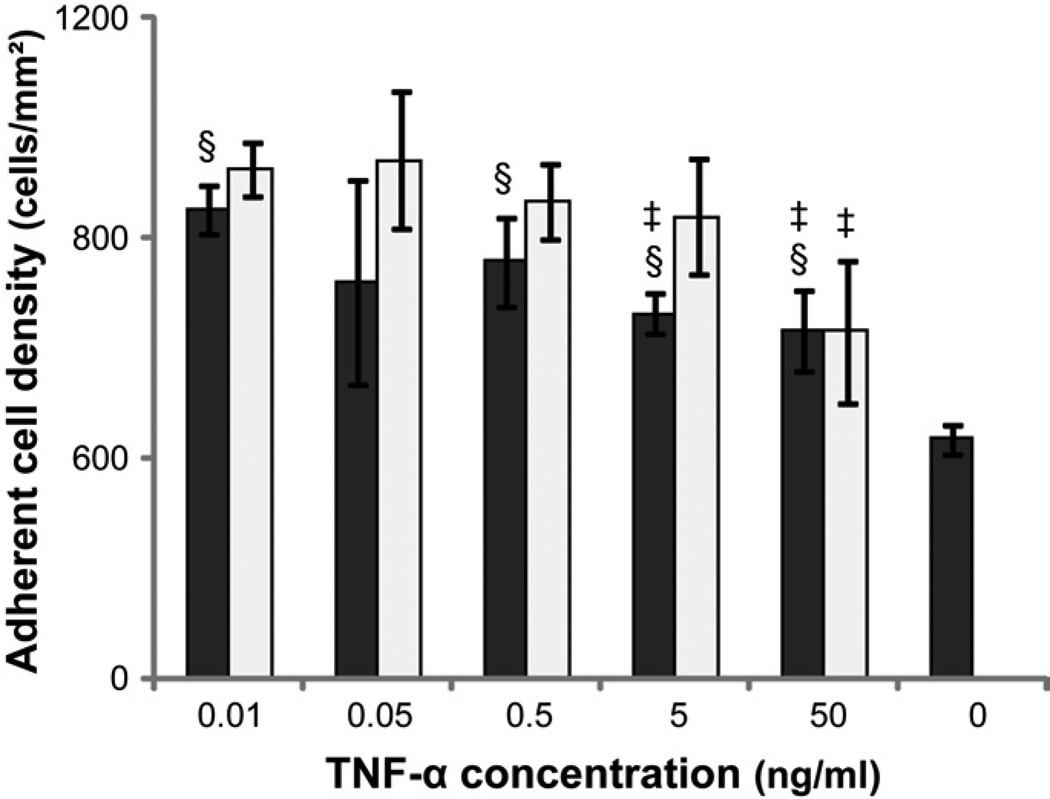 ) or 12 () hours in media supplemented 0.01, 0.05, 0.5, 5 or 50 ng/mL human recombinant TNF-α. Media without exogenous TNF-α served as the control. §: significantly different compared to the control without cells at 2 hours, p<0.05; ‡: significantly different compared to the cell number at the same time point treated with 0.01 ng/mL TNF-α, p<0.05.
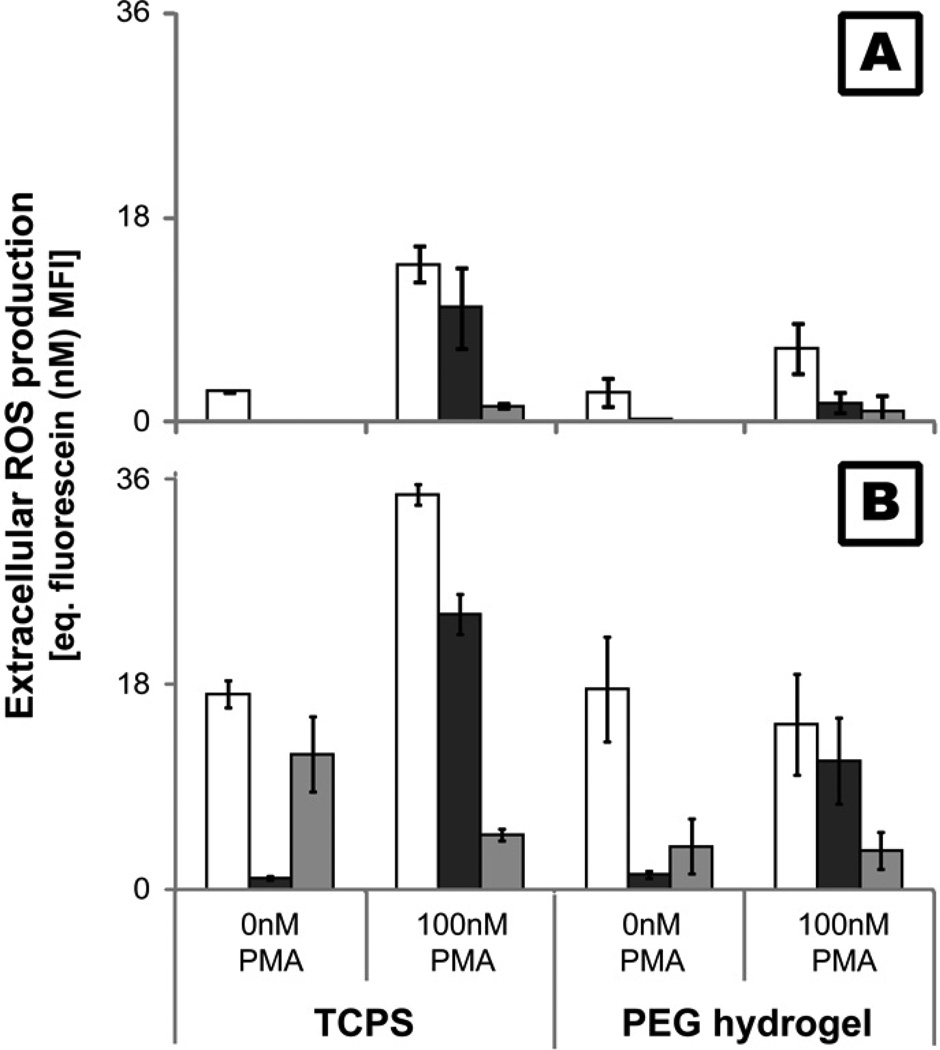 ), 24() and 96(
 ) hr. ROS levels were determined using a cell membrane impermeable probe which fluoresces upon oxidation (485ex/520em).
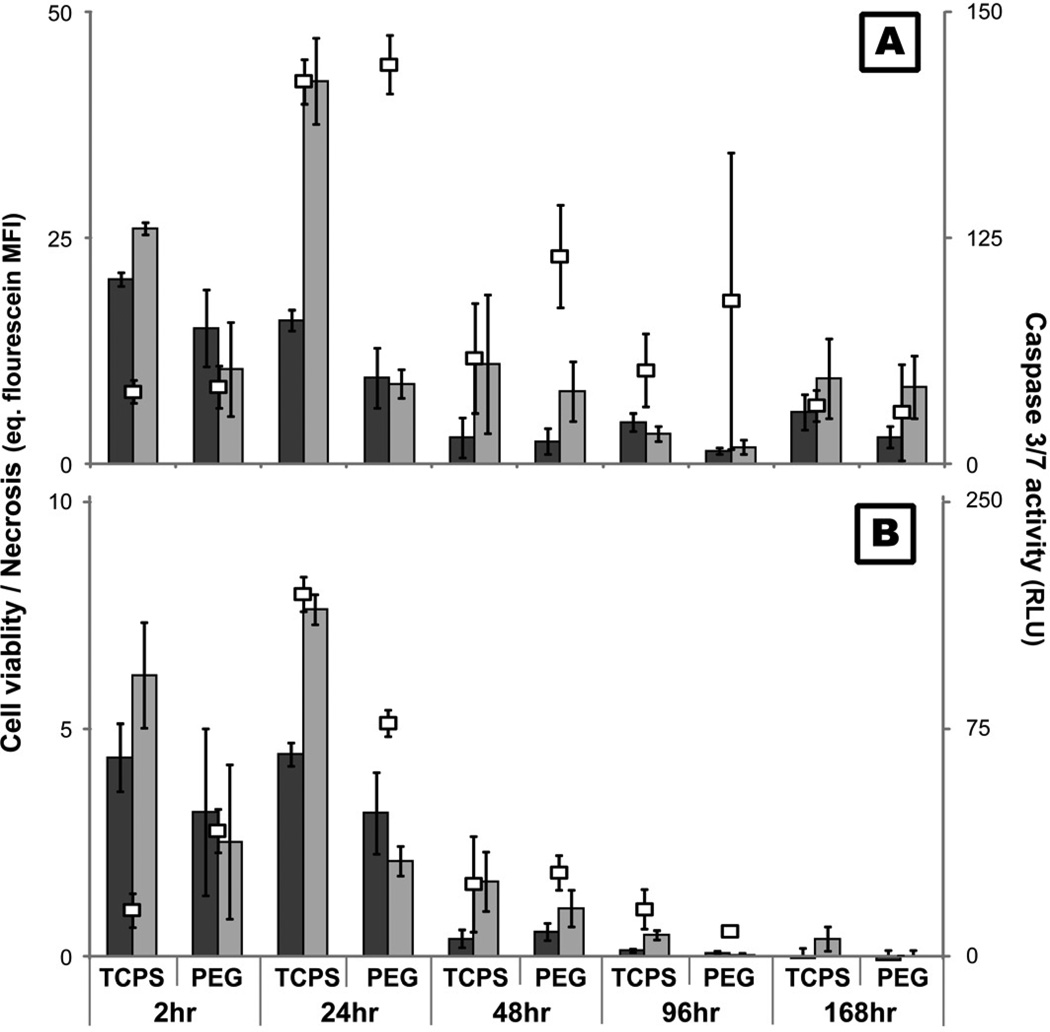 ), apoptosis (), and necrosis () at 2, 24, 48, 96, and 168hr after exposure to TCPS and PEG hydrogel substrates. Viability was assessed by measuring the cleavage of a fluorogenic, cell-permeant, peptide substrate by cells with intact membranes. Primary and secondary necrosis is assessed by measuring the cleavage of fluorogenic, cell-impermeant, peptide substrate, by a “dead-cell protease” which is released from cells with permeable membranes. Mean fluorescent intensity (MFI) of the samples were compared to a fluorescein standard curve to allow for comparison between time points. Finally, cleavage of a luminogenic caspase-3/7 substrate was used to assess apoptosis.
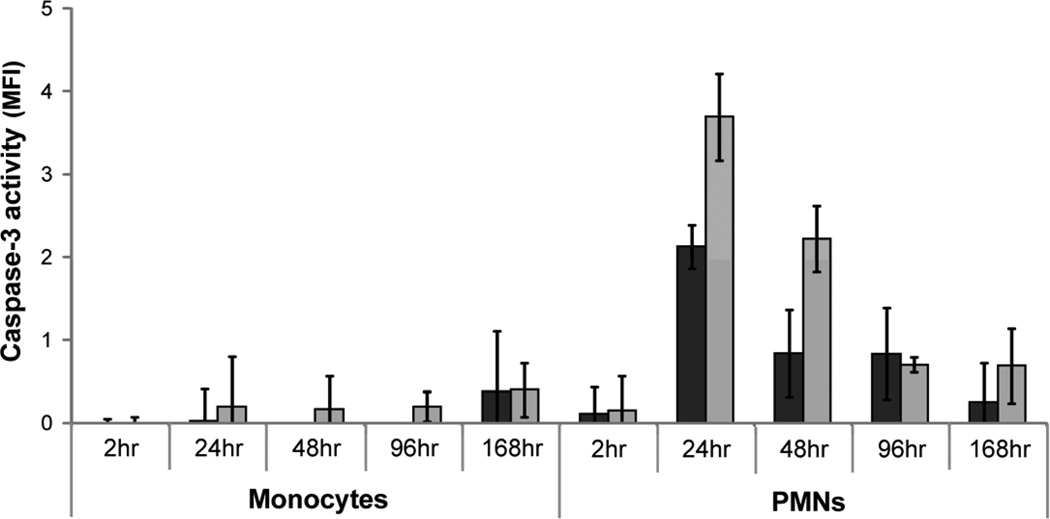 ) and PEG hydrogel () substrates for 2, 24, 48, 96, and 168hr were exposed to fluorogenic caspase-3 substrate and the mean fluorescence intensity from the cleaved probe was assessed.
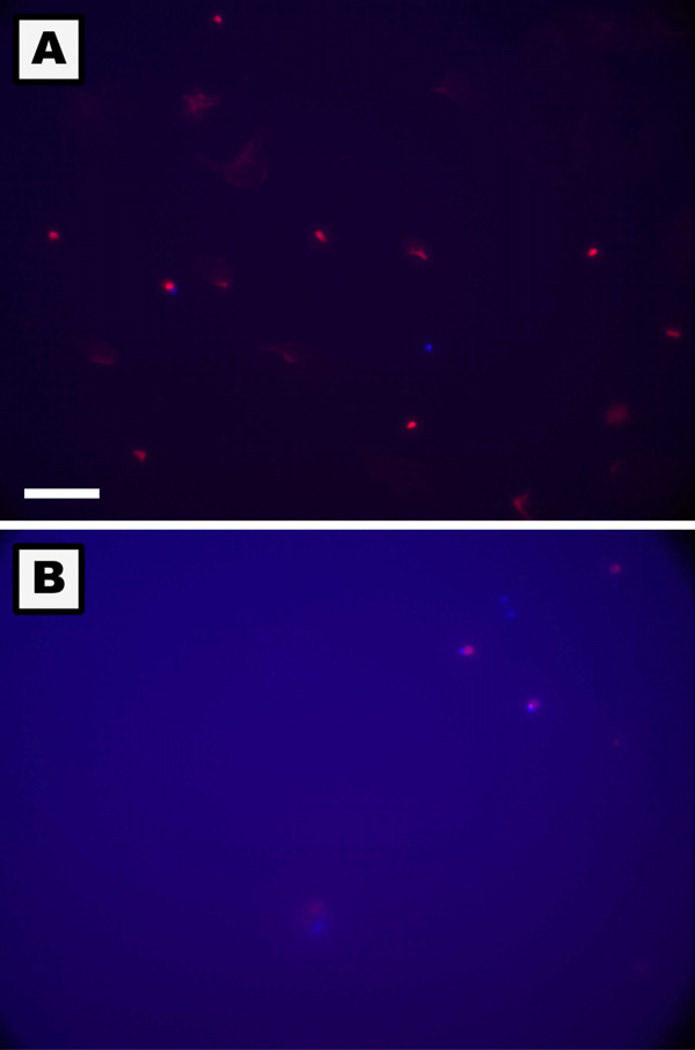
Similar articles
-
Fetal bovine serum xenoproteins modulate human monocyte adhesion and protein release on biomaterials in vitro.Acta Biomater. 2011 Feb;7(2):515-25. doi: 10.1016/j.actbio.2010.08.022. Epub 2010 Sep 15. Acta Biomater. 2011. PMID: 20837169 Free PMC article.
-
Poly(ethylene glycol)-containing hydrogels modulate α-defensin release from polymorphonuclear leukocytes and monocyte recruitment.J Biomed Mater Res A. 2015 Dec;103(12):3772-80. doi: 10.1002/jbm.a.35519. Epub 2015 Jun 26. J Biomed Mater Res A. 2015. PMID: 26053326
-
Monocyte activation in response to polyethylene glycol hydrogels grafted with RGD and PHSRN separated by interpositional spacers of various lengths.J Biomed Mater Res A. 2007 Dec 1;83(3):617-25. doi: 10.1002/jbm.a.31270. J Biomed Mater Res A. 2007. PMID: 17503491
-
Fibroblasts regulate monocyte response to ECM-derived matrix: the effects on monocyte adhesion and the production of inflammatory, matrix remodeling, and growth factor proteins.J Biomed Mater Res A. 2009 Jun 15;89(4):841-53. doi: 10.1002/jbm.a.32431. J Biomed Mater Res A. 2009. PMID: 19437738 Free PMC article.
-
Identification of regulatory Hck and PAI-2 proteins in the monocyte response to PEG-containing matrices.Biomaterials. 2009 Aug;30(23-24):3825-33. doi: 10.1016/j.biomaterials.2009.04.007. Epub 2009 May 14. Biomaterials. 2009. PMID: 19443025 Free PMC article.
Cited by
-
PEGylation of model drug carriers enhances phagocytosis by primary human neutrophils.Acta Biomater. 2018 Oct 1;79:283-293. doi: 10.1016/j.actbio.2018.09.001. Epub 2018 Sep 6. Acta Biomater. 2018. PMID: 30195083 Free PMC article.
-
Mesenchymal Stromal/Stem Cell and Minocycline-Loaded Hydrogels Inhibit the Growth of Staphylococcus aureus that Evades Immunomodulation of Blood-Derived Leukocytes.AAPS J. 2015 May;17(3):620-30. doi: 10.1208/s12248-015-9728-6. Epub 2015 Feb 26. AAPS J. 2015. PMID: 25716147 Free PMC article.
-
Purinergic signaling in early inflammatory events of the foreign body response: modulating extracellular ATP as an enabling technology for engineered implants and tissues.Tissue Eng Part B Rev. 2014 Oct;20(5):392-402. doi: 10.1089/ten.TEB.2013.0554. Epub 2014 Jan 16. Tissue Eng Part B Rev. 2014. PMID: 24279914 Free PMC article. Review.
-
Combinatorial biomatrix/cell-based therapies for restoration of host tissue architecture and function.Adv Healthc Mater. 2013 Dec;2(12):1544-63. doi: 10.1002/adhm.201300063. Epub 2013 Jul 5. Adv Healthc Mater. 2013. PMID: 23828863 Free PMC article. Review.
-
Cell encapsulating biomaterial regulates mesenchymal stromal/stem cell differentiation and macrophage immunophenotype.Stem Cells Transl Med. 2012 Oct;1(10):740-9. doi: 10.5966/sctm.2012-0061. Epub 2012 Oct 10. Stem Cells Transl Med. 2012. PMID: 23197666 Free PMC article.
References
-
- Lucas T, Waisman A, Ranjan R, Roes J, Krieg T, Muller W, et al. Differential roles of macrophages in diverse phases of skin repair. J Immunol. 2010;184:3964–3977. - PubMed
-
- Eming SA, Krieg T, Davidson JM. Inflammation in wound repair: molecular and cellular mechanisms. J Invest Dermatol. 2007;127:514–525. - PubMed
-
- Anderson JM. Inflammation, wound healing, and the foreign-body response. In: Ratner BD, Hoffman AS, Schhoen FJ, Lemons JE, editors. Biomaterials Science: An introduction to materials in medicine. 2nd ed. Amsterdam; Boston: Elsevier Academic Press; 2004. pp. 296–304.
-
- Soehnlein O, Lindbom L. Phagocyte partnership during the onset and resolution of inflammation. Nat Rev Immunol. 2010;10:427–39. - PubMed
-
- Thannickal VJ, Fanburg BL. Reactive oxygen species in cell signaling. Am J Physiol Lung Cell Mol Physiol. 2000;279:L1005–L1028. - PubMed
Publication types
MeSH terms
Substances
Grants and funding
LinkOut - more resources
Full Text Sources
