

Simultaneous quantification of nicotine and metabolites in rat brain by liquid chromatography-tandem mass spectrometry
- PMID: 21963483
- PMCID: PMC3210385
- DOI: 10.1016/j.jchromb.2011.09.026
Simultaneous quantification of nicotine and metabolites in rat brain by liquid chromatography-tandem mass spectrometry
Abstract
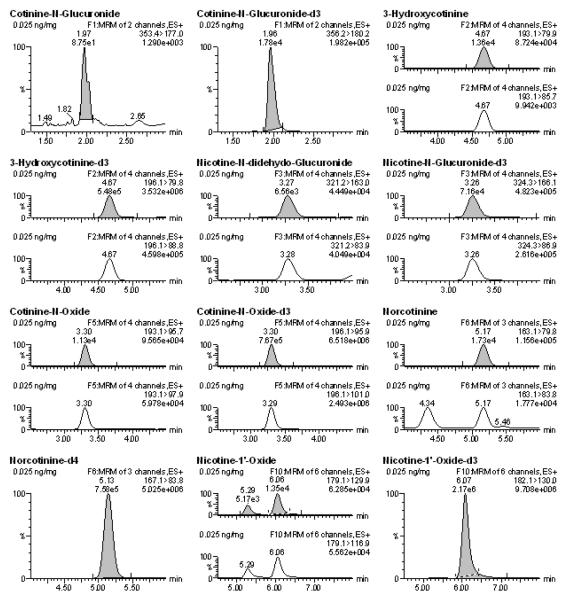
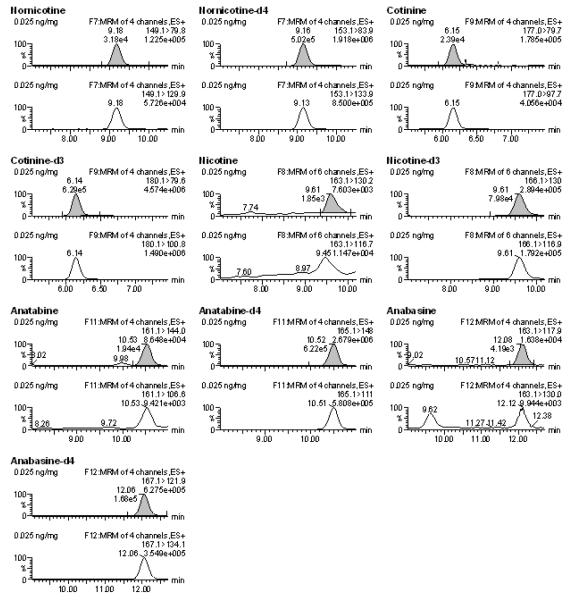
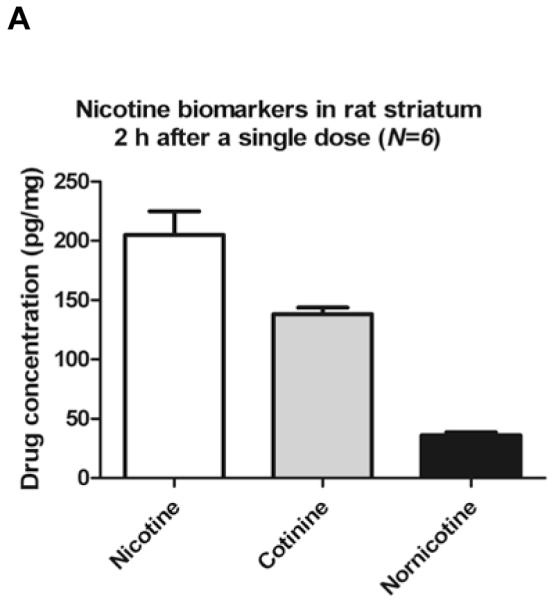
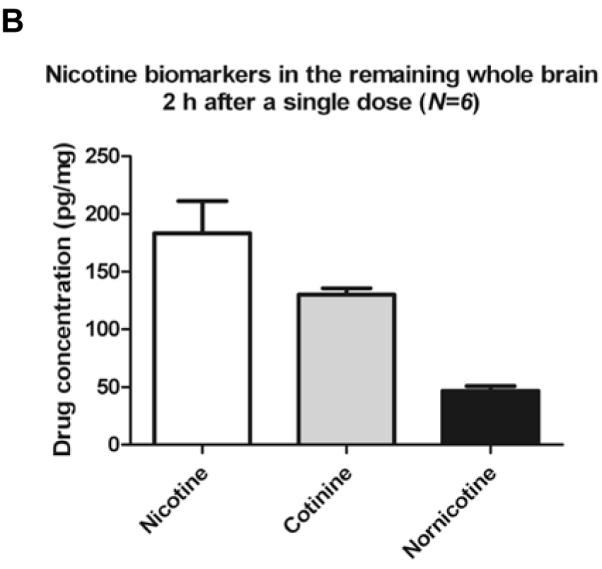
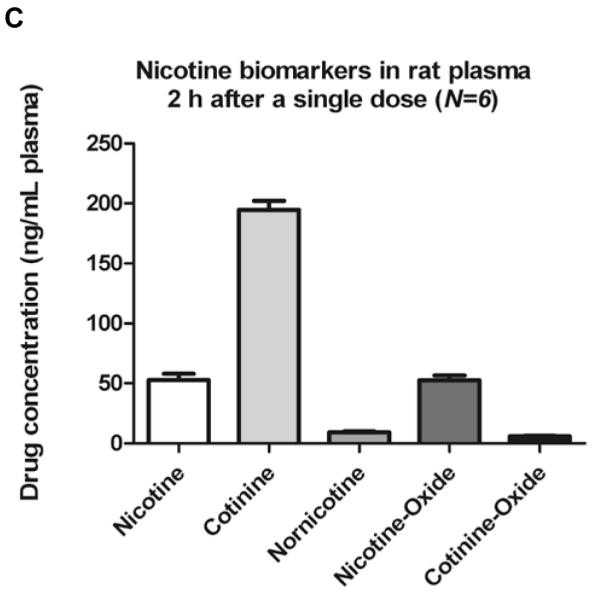
A liquid chromatography-tandem mass spectrometry (LC-MS/MS) method for simultaneous quantification of nicotine (NIC), cotinine (COT), nornicotine (NNIC), norcotinine (NCOT), nicotine-N-β-D-glucuronide (NIC GLUC), cotinine-N-β-D-glucuronide (COT GLUC), nicotine-1'-oxide (NNO), cotinine-N-oxide (CNO), trans-3'-hydroxycotinine (3-HC), anabasine (AB) and anatabine (AT) was modified and validated for quantification of these selected analytes in rat brain tissue. This analytical method provides support for preclinical NIC pharmacokinetic and toxicological studies after controlled dosing protocols. After brain homogenization and solid-phase extraction, target analytes and corresponding deuterated internal standards were chromatographically separated on a Discovery(®) HS F5 HPLC column with gradient elution and analyzed by LC-MS/MS in positive electrospray ionization (ESI) mode with multiple reaction monitoring (MRM) data acquisition. Method linearity was assessed and calibration curves were determined over the following ranges: 0.1-7.5 ng/mg for NIC, COT GLUC and AB; and 0.025-7.5 ng/mg for COT, NNIC, NCOT, NIC GLUC, NNO, CNO, 3-HC and AT (R(2)≥0.99 for all analytes). Extraction recoveries ranged from 64% to 115%, LC-MS/MS matrix effects were ≤21%, and overall process efficiency ranged from 57% to 93% at low and high quality control concentrations. Intra- and inter-assay imprecisions and accuracy for all analytes were ≤12.9% and ≥86%, respectively. The method was successfully applied to quantification of NIC and metabolites in the brain of post-natal day 90 rats that were sacrificed 2-h after a single 0.8 mg/kg s.c. administration of (-)NIC. In these tissues, striatal concentrations were 204.8±49.4, 138.2±14.2 and 36.1±6.1 pg/mg of NIC, COT and NNIC, respectively. Concentrations of NIC, COT and NNIC in the remaining whole brain (RWhB) were 183.3±68.0, 130.0±14.1 and 46.7±10.3 pg/mg, respectively. Quantification of these same analytes in plasma was also performed by a previously validated method. NIC, COT, NNIC, NCOT, NNO and CNO were detected in plasma with concentrations comparable to those reported in previous studies. However, and in contrast to brain tissues, COT concentrations in plasma were significantly higher than were those of NIC (194.6±18.6 ng/mL versus 52.7±12.9 ng/mL). Taken together, these results demonstrate that a sensitive and selective method has been developed for the determination of NIC biomarkers in rat brain.
Published by Elsevier B.V.
Figures
Similar articles
-
Simultaneous quantification of tobacco alkaloids and major phase I metabolites by LC-MS/MS in human tissue.Int J Legal Med. 2015 Mar;129(2):279-87. doi: 10.1007/s00414-014-1093-y. Epub 2014 Oct 11. Int J Legal Med. 2015. PMID: 25304849
-
A novel validated procedure for the determination of nicotine, eight nicotine metabolites and two minor tobacco alkaloids in human plasma or urine by solid-phase extraction coupled with liquid chromatography-electrospray ionization-tandem mass spectrometry.J Chromatogr B Analyt Technol Biomed Life Sci. 2010 Mar 15;878(9-10):725-37. doi: 10.1016/j.jchromb.2009.12.018. Epub 2009 Dec 22. J Chromatogr B Analyt Technol Biomed Life Sci. 2010. PMID: 20097626 Free PMC article.
-
Identification and quantification of nicotine biomarkers in human oral fluid from individuals receiving low-dose transdermal nicotine: a preliminary study.J Anal Toxicol. 2010 Sep;34(7):357-66. doi: 10.1093/jat/34.7.357. J Anal Toxicol. 2010. PMID: 20822672
-
Assessment of nicotine delivery and uptake in users of various tobacco/nicotine products.Curr Res Toxicol. 2022 Mar 11;3:100067. doi: 10.1016/j.crtox.2022.100067. eCollection 2022. Curr Res Toxicol. 2022. PMID: 35330709 Free PMC article.
-
Measurement of nicotine, cotinine and trans-3'-hydroxycotinine in meconium by liquid chromatography-tandem mass spectrometry.J Chromatogr B Analyt Technol Biomed Life Sci. 2011 Jul 15;879(22):2142-8. doi: 10.1016/j.jchromb.2011.05.054. Epub 2011 Jun 12. J Chromatogr B Analyt Technol Biomed Life Sci. 2011. PMID: 21689995
Cited by
-
Palladium Hydroxide (Pearlman's Catalyst) Doped MXene (Ti3C2Tx) Composite Modified Electrode for Selective Detection of Nicotine in Human Sweat.Biosensors (Basel). 2022 Dec 29;13(1):54. doi: 10.3390/bios13010054. Biosensors (Basel). 2022. PMID: 36671889 Free PMC article.
-
The cytisine derivatives, CC4 and CC26, reduce nicotine-induced conditioned place preference in zebrafish by acting on heteromeric neuronal nicotinic acetylcholine receptors.Psychopharmacology (Berl). 2014 Dec;231(24):4681-93. doi: 10.1007/s00213-014-3619-x. Epub 2014 May 27. Psychopharmacology (Berl). 2014. PMID: 24862365
-
The chemical components of electronic cigarette cartridges and refill fluids: review of analytical methods.Nicotine Tob Res. 2015 Mar;17(3):271-9. doi: 10.1093/ntr/ntu197. Epub 2014 Sep 25. Nicotine Tob Res. 2015. PMID: 25257980 Free PMC article. Review.
-
Quantitation of cotinine and its metabolites in rat plasma and brain tissue by hydrophilic interaction chromatography tandem mass spectrometry (HILIC-MS/MS).J Chromatogr B Analyt Technol Biomed Life Sci. 2012 Oct 15;907:117-25. doi: 10.1016/j.jchromb.2012.09.018. Epub 2012 Sep 15. J Chromatogr B Analyt Technol Biomed Life Sci. 2012. PMID: 23022114 Free PMC article.
-
VMAT1 deletion causes neuronal loss in the hippocampus and neurocognitive deficits in spatial discrimination.Neuroscience. 2013 Mar 1;232:32-44. doi: 10.1016/j.neuroscience.2012.11.023. Epub 2012 Nov 29. Neuroscience. 2013. PMID: 23201251 Free PMC article.
References
-
- Alexandrov K, Rojas M, Satarug S. Toxicology letters. 2010;198:63–68. - PubMed
Publication types
MeSH terms
Substances
Grants and funding
LinkOut - more resources
Full Text Sources
Miscellaneous
