. 2011 Oct 2;17(10):1304-9.
doi: 10.1038/nm.2497.

The calcineurin inhibitor tacrolimus activates the renal sodium chloride cotransporter to cause hypertension

Affiliations

The calcineurin inhibitor tacrolimus activates the renal sodium chloride cotransporter to cause hypertension

Ewout J Hoorn et al. Nat Med. .

Abstract

Calcineurin inhibitors (CNIs) are immunosuppressive drugs that are used widely to prevent rejection of transplanted organs and to treat autoimmune disease. Hypertension and renal tubule dysfunction, including hyperkalemia, hypercalciuria and acidosis, often complicate their use. These side effects resemble familial hyperkalemic hypertension, a genetic disease characterized by overactivity of the renal sodium chloride cotransporter (NCC) and caused by mutations in genes encoding WNK kinases. We hypothesized that CNIs induce hypertension by stimulating NCC. In wild-type mice, the CNI tacrolimus caused salt-sensitive hypertension and increased the abundance of phosphorylated NCC and the NCC-regulatory kinases WNK3, WNK4 and SPAK. We demonstrated the functional importance of NCC in this response by showing that tacrolimus did not affect blood pressure in NCC-knockout mice, whereas the hypertensive response to tacrolimus was exaggerated in mice overexpressing NCC. Moreover, hydrochlorothiazide, an NCC-blocking drug, reversed tacrolimus-induced hypertension. These observations were extended to humans by showing that kidney transplant recipients treated with tacrolimus had a greater fractional chloride excretion in response to bendroflumethiazide, another NCC-blocking drug, than individuals not treated with tacrolimus; renal NCC abundance was also greater. Together, these findings indicate that tacrolimus-induced chronic hypertension is mediated largely by NCC activation, and suggest that inexpensive and well-tolerated thiazide diuretics may be especially effective in preventing the complications of CNI treatment.


Figures
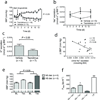
Figure 1
Figure 1. Effects of tacrolimus on arterial pressure and electrolyte handing in mice
(a) Effects of tacrolimus on systolic blood pressure (SBP) during 14 days. Of note, the first day after starting injections, a transient rise in SBP was observed in both groups. Significant differences were determined by two-way ANOVA. (b) Effects of tacrolimus on twenty four hour urine sodium excretion. * indicates P<0.05 by ANOVA. (c) Effects of tacrolimus on twenty four hour urine potassium excretion. (d) Correlation between urine sodium excretion and BP rise with tacrolimus, calculated as the change from the average baseline value to the final day SBP. Significance was determined using linear regression. (e) Comparison of the rise in SBP caused by tacrolimus (Tac) treatment during high salt (HS) and normal salt (NS) diet. During the baseline (BL) BP measurements, both groups were fed the NS diet. The P-value was obtained using two-way ANOVA to analyze whether the change in blood pressure in one group was significantly different from change in blood pressure in the other group. (f) Effect of tacrolimus (Tac, n=13) on plasma aldosterone levels (PAldo), compared with vehicle (Veh) (n=5), during normal salt (NS) diet. High salt (HS) suppressed plasma aldosterone despite Tac (n=5). As an illustration of an activated renin angiotensin system, plasma aldosterone levels are also shown in untreated wild-type mice fed a low sodium diet (LS, n=5). * indicates P<0.05, compared with NS + Veh.
Figure 2
Figure 2. Effects of tracolimus on transport proteins and kinases in kidney and in vitro
(a) Localization of calcineurin A-α in kidney; left panels show immunohistochemical detection of calcineurin, whereas right panels show NCC in the same field delineating distal convoluted tubules. A control without primary antibody is shown, for comparison. • indicates distal convoluted tubule. (b) Immunoblot images showing effects of tacrolimus on the sodium chloride cotransporters (NCC and pNCC, at approximately 130 kDa, and NKCC2 and pNKCC2 at approximately 140 kDa) and on the calcium channel TRPV5 (at approximately 90 kDa). Graphs of densitometry analysis for each are shown at the right, normalized for actin. (c) Immunoblot images showing effects of tacrolimus on WNK3 (at approximately 200 kDa), WNK4 (at approximately 150 kDa) and SPAK. Densitometry is shown at the right, normalized for actin; densitometry of SPAK was performed by averaging all isoforms. (d) Immunoblot images showing effects of tacrolimus on HEK293 cells. NCC expression was undetectable, when cells were not induced with tetracycline (Un). Induced cells were either untreated (0), treated with vehicle (Veh) or with tacrolimus (Tac). The total NCC ran at approximately 130 kDa (*) and 110 kDa (#), indicating mature and immature forms, respectively, whereas phosphorylated NCC ran only at 130 kDa. Representative immunoblots are shown. Densitometry was normalized for actin (not shown).
Figure 3
Figure 3. Effects of tacrolimus on blood pressure (BP) and sodium handling in mice in which NCC was deleted, inhibited or over-expressed
(a) Effects of tacrolimus on SBP of NCC knockout mice and littermates. Of note, the first day after starting the injections of tacrolimus or vehicle, a transient rise in BP was observed in both groups. (b) Effect of treatment with hydrochlorothiazide (HCTZ) or vehicle (Veh) on established tacrolimus-induced hypertension in wild type mice. Statistical analysis was performed by independent t-tests.; (c) Effects of HCTZ on urine sodium to creatinine ratio (UNa/UCreat) in tacrolimus-treated animals (HCTZ + Tac) and in untreated mice (HCTZ only). For comparison, UNa/UCreat in tacrolimus-treated animals given vehicle is also shown. (d) Comparison of effects of tacrolimus treatment (Tac) on blood pressure in wild type and transgenic mice overexpressing NCC. Baseline and final day BPs are shown. The P-value was obtained using two-way ANOVA to analyze whether the change in BP from baseline to the final day in one group was significantly different from the other group. Of note, the Tg (NCC) mice and their wild-type controls had a lower baseline BP than the mice in the previous experiments, which was attributed to a strain-difference (see Methods), as reported previously. (e) Effect of tacrolimus on total and phosphorylated NCC in NCC transgenic mice and wild type littermates. (f) Quantification of effects of tacrolimus on phosphorylated NCC in wild type and NCC transgenic mice, normalized for actin.
Figure 4
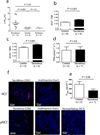
Figure 4. Functional data and immunostaining in patients with CNI-induced hypertension compared with controls
(a) Comparison of effects of 10 mg bendroflumethiazide on fractional chloride excretion (ΔFECl) in kidney transplant patients with tacrolimus-induced hypertension (Tacrolimus), healthy volunteers (Control), and kidney transplant patients receiving sirolimus (Sirolimus). (b) Comparison of extracellular fluid volume versus total body fluid volume (ECF/TBF) in kidney transplant patients with tacrolimus-induced hypertension compared with controls, measured by bioimpedance. (c) Comparison of the ratio of extracellular to total body water (ECW/TBW) in kidney transplant patients with tacrolimus-induced hypertension compared with controls, measured by bioimpedance. (d) Comparison of plasma renin activity (PRA) in kidney transplant patients with tacrolimus-induced hypertension compared with controls. (e) comparison of plasma aldosterone concentration (PAldo) in kidney transplant patients with tacrolimus-induced hypertension compared with controls. (f) Representative confocal immunofluorescence images of renal tissue showing the sodium chloride cotransporter (NCC) and the activated sodium chloride cotransporter (pNCC) in kidney transplant patients with tacrolimus-induced hypertension compared with azathioprine-treated kidney transplant patients, and with healthy controls. Images from additional biopsies and clinical characteristics are provided in Supplementary Tables 4–6 and Supplementary Figure 3.

Similar articles

Cited by

References

    1. Kim HC, et al. Primary immunosuppression with tacrolimus in kidney transplantation: three-year follow-up in a single center. Transplant. Proc. 2004;36:2082–2083. - PubMed
    1. Jain A, et al. What have we learned about primary liver transplantation under tacrolimus immunosuppression? Long-term follow-up of the first 1000 patients. Ann. Surg. 1999;230:441–448. discussion 448–449. - PMC - PubMed
    1. Nijenhuis T, Hoenderop JG, Bindels RJ. Downregulation of Ca(2+) and Mg(2+) transport proteins in the kidney explains tacrolimus (FK506)-induced hypercalciuria and hypomagnesemia. J Am Soc Nephrol. 2004;15:549–557. - PubMed
    1. Mohebbi N, Mihailova M, Wagner CA. The calcineurin inhibitor FK506 (tacrolimus) is associated with transient metabolic acidosis and altered expression of renal acid-base transport proteins. American journal of physiology. Renal physiology. 2009;297:F499–F509. - PubMed
    1. Takeda Y, Miyamori I, Furukawa K, Inaba S, Mabuchi H. Mechanisms of FK 506-induced hypertension in the rat. Hypertension. 1999;33:130–136. - PubMed

Publication types

MeSH terms