. 2012 Jan;63(1):503-15.
doi: 10.1093/jxb/err301. Epub 2011 Sep 30.

Glutaredoxin GRXS13 plays a key role in protection against photooxidative stress in Arabidopsis

Affiliations

Glutaredoxin GRXS13 plays a key role in protection against photooxidative stress in Arabidopsis

Daniel Laporte et al. J Exp Bot. 2012 Jan.

Abstract

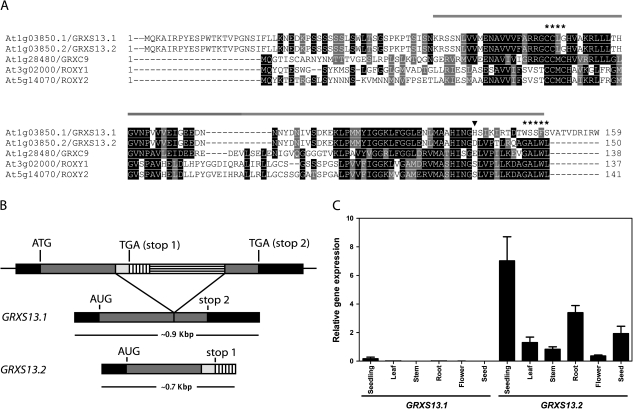
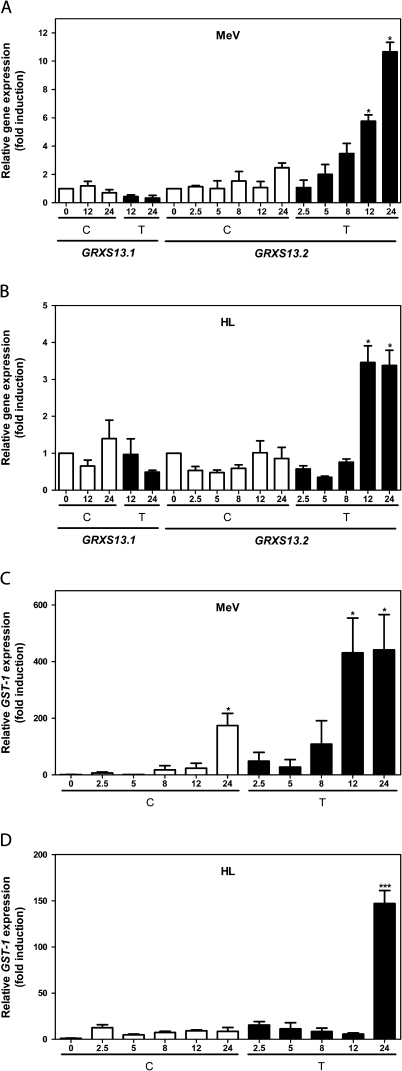
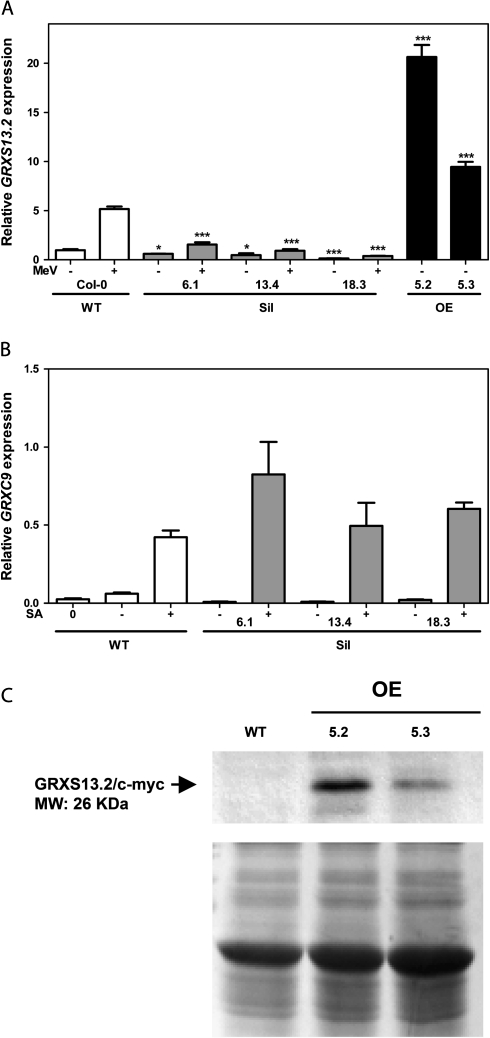
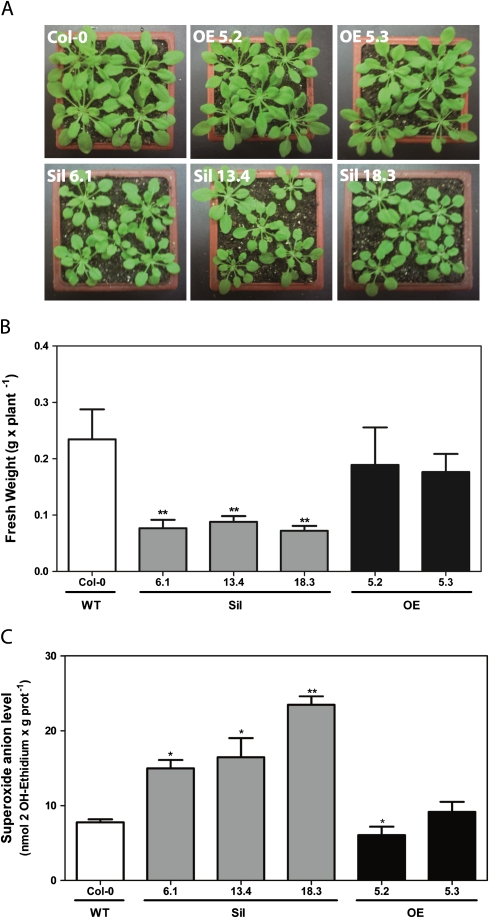
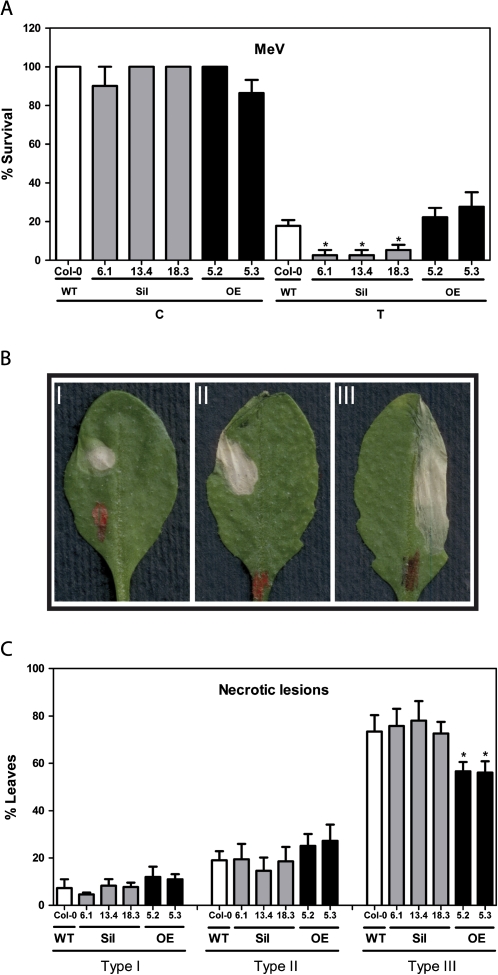
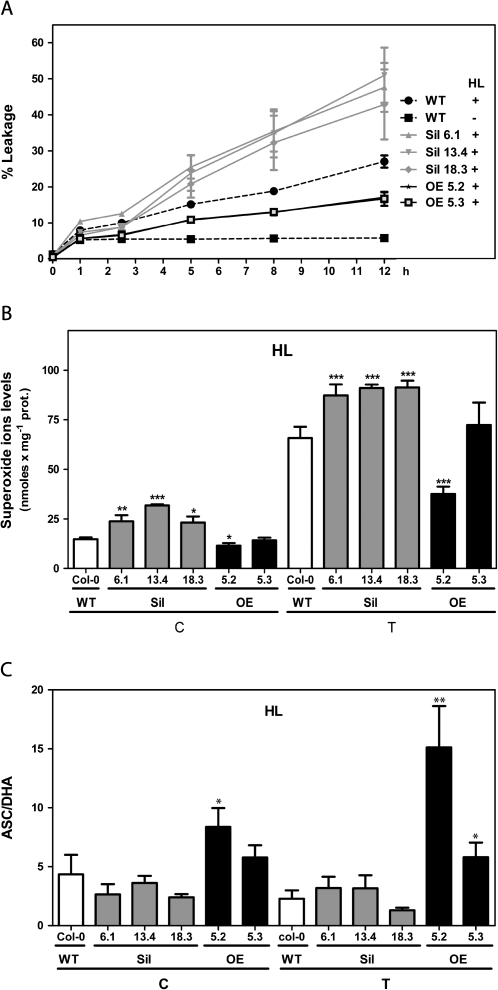
Glutaredoxins (GRXs) belong to the antioxidant and signalling network involved in the cellular response to oxidative stress in bacterial and eukaryotic cells. In spite of the high number of GRX genes in plant genomes, the biological functions and physiological roles of most of them remain unknown. Here the functional characterization of the Arabidopsis GRXS13 gene (At1g03850), that codes for two CC-type GRX isoforms, is reported. The transcript variant coding for the GRXS13.2 isoform is predominantly expressed under basal conditions and is the isoform that is induced by photooxidative stress. Transgenic lines where the GRXS13 gene has been knocked down show increased basal levels of superoxide radicals and reduced plant growth. These lines also display reduced tolerance to methyl viologen (MeV) and high light (HL) treatments, both conditions of photooxidative stress characterized by increased production of superoxide ions. Consistently, lines overexpressing the GRXS13.2 variant show reduced MeV- and HL-induced damage. Alterations in GRXS13 expression also affect superoxide levels and the ascorbate/dehydroascorbate ratio after HL-induced stress. These results indicate that GRXS13 gene expression is critical for limiting basal and photooxidative stress-induced reactive oxygen species (ROS) production. Together, these results place GRXS13.2 as a member of the ROS-scavenging/antioxidant network that shows a particularly low functional redundancy in the Arabidopsis GRX family.


Figures

Fig. 1.
Fig. 1.
The GRXS13 gene codes for two CC-type GRX isoforms, GRXS13.2 being the predominantly expressed isoform in Arabidopsis seedlings. (A) Multiple sequence alignment of amino acid sequences for GRXS13 isoforms and the three previously characterized CC-type GRXs from Arabidopsis (GRXC9, ROXY1, and ROXY2). The glutaredoxin domain (amino acids 53–149; http://www.uniprot.org/uniprot/Q84TF4) is indicated by the line drawn above the sequences; the CCLG active site and the GALWL motif are indicated by asterisks (*); GRXS13.1 and GRXS13.2 are identical up to residue 136 (arrowhead). Black boxes are used to indicate amino acid identity, while grey boxes indicate amino acid similarity. (B) Transcript processing of GRXS13 gene variants. The 23 amino acid C-terminus of GRXS13.1 is encoded by the second exon, while the 14 amino acid C-terminus of GRXS13.2 is encoded by part of the gene intron. (C) Expression pattern of GRXS13 gene variants in Arabidopsis seedlings (15 d old), in leaves, stems, roots, and flowers from adult plants (5 weeks old), and in seeds. GRXS13.1 and GRXS13.2 transcript levels were quantified by qRT-PCR and normalized by clathrin transcript levels. Data are presented as normalized transcript levels and correspond to mean values ±SD from three biological replicas.
Fig. 2.
Fig. 2.
The GRXS13.2 gene variant is induced by methyl viologen (MeV) and high light (HL) stress treatments. Transcript levels for GRXS13.1 and GRXS13.2 (A, B) and GST-1 (C, D) were measured using qRT-PCR in 15-day-old Arabidopsis seedlings at different times (in hours) after treatments (black bars) with 50 μM MeV (A, C) or with HL (1000 μmol m−2 s−1) (B, D). Control treatments were performed in MS medium (white bars). Transcript levels of GRXS13.1 and GRXS13.2 variants were normalized by comparison with a reference gene, and the extent of gene induction was calculated with regard to the basal level (time 0) for the corresponding variant. Clathrin was used to normalize GRXS13.1 and GRXS13.2 expression, while UBQ10 was used to normalize GST-1 expression. Data corresponds to mean values ±SD from three biological replicas. Statistical analysis was performed using the paired Mann–Whitney test with the GraphPad Prism 5 program. Values showing statistically significant differences relative to the corresponding WT samples are indicated by asterisks (*P < 0.05 and ***P < 0.001).
Fig. 3.
Fig. 3.
Characterization of Arabidopsis transgenic lines silencing (Sil) and overexpressing (OE) the GRXS13 gene. Homozygous 35S::GRXS13-RNAi lines (Sil lines 6.1, 13.4, and 18.3) and 35S::GRXS13.2-Myc lines (OE lines 5.2 and 5.3) were obtained using the Gateway® cloning technology and Agrobacterium-mediated transformation. Transcript levels of GRXS13.2 (A) and GRXC9 (B) were determined by qRT-PCR in WT (white bars), Sil lines (grey bars), and OE lines (black bars), treated or not with methyl viologen (+/– MeV, 50 μM) for 12 h (A) or salicylic acid (+/– SA, 0.5 mM) for 2.5 h (B). Expression data are indicated as relative levels with respect to the basal level in WT plants and represent mean values ±SD from three biological replicas. Data were analysed by two-way ANOVA with Bonferroni post-test. Values showing statistically significant differences relative to the corresponding WT samples are indicated by asterisks (*P < 0.05 and ***P < 0.001). (C) Immunoblot for GRXS13.2-Myc protein detection in OE lines. A 30 μg aliquot of total protein extracts from WT (Col-0) and two transgenic OE lines (5.2 and 5.3) was loaded on an SDS–polyacrylamide gel, transferred to a membrane, and the GRXS13.2-Myc protein was detected with a commercial monoclonal anti-c-myc antibody (Invitrogen) (upper panel, arrowhead). Coomassie Brilliant Blue staining (lower panel) indicates that equivalent amounts of proteins were loaded.
Fig. 4.
Fig. 4.
Effect of knocking down and overexpressing the GRXS13 gene on plant growth and superoxide radical basal levels. (A and B) GRXS13 gene knock down reduced plant growth. Plant biomass (determined by fresh weight) was measured in 6-week-old plants from WT (Col-0, white bar), Sil lines (grey bars), and OE lines (black bars) grown under short-day conditions (8 h light). Data represent mean values ±SD from five biological replicas. (C) GRXS13 gene knock down increased basal levels of superoxide ion. In vivo levels of superoxide radical were determined in 15-day-old seedlings from WT (white bar), Sil lines, (grey bars), and OE lines (black bars), through the oxidized fluorescent probe 2-hydroxy ethidium (2OH-E). Data represent mean values ±SD from four biological replicas. Data were analysed by the paired Mann–Whitney test using the GraphPad Prism 5 program. Values showing statistically significant differences relative to the corresponding WT samples are indicated by asterisks (*P <0.05 and **P < 0.01).
Fig. 5.
Fig. 5.
Effect of knocking down and overexpressing GRXS13.2 on the tolerance to methyl viologen (MeV) treatment. (A) Silencing of the GRXS13 gene reduced the ability of Arabidopsis plants to survive in the presence of MeV. Seeds from WT (white bars), Sil lines (grey bars), and OE lines (black bars) were germinated on MS medium alone (C) or supplemented with 0.25 μM MeV (T) under controlled conditions (16 h light, 100 μmol m−2 s−1, 22±2 °C). At day 4, seedlings were scored for survival rates (percentage of green seedlings with respect to the total germinated seedlings); these scores were compared with the corresponding values of untreated WT seedlings (100%). Data represent mean values ±SD from six biological replicas. (B and C) Overexpressing GRXS13.2 reduces necrotic symptoms after MeV treatment. Analysis of necrotic symptoms that developed in leaves of 5-week-old plants of WT (white bars), Sil lines (grey bars), and OE lines (black bars) after 2 d of MeV treatment (a 2 μl drop of a 15 μM MeV solution). Representative examples of symptoms which developed after MeV treatments are shown in (B). According to the extension of the leaf necrotic area, lesions were scored in a three-point scale I, II, and III, as described in the Materials and methods. (C) The percentage of leaves showing each of the symptoms at day 2 after MeV treatment was scored. Statistical analyses were performed using two-way ANOVA with Bonferroni post-test with the GraphPad Prism 5 program. Values that show statistically significant differences relative to the corresponding WT samples are indicated by an asterisk (P < 0.05).
Fig. 6.
Fig. 6.
Effect of knocking down and overexpressing GRXS13.2 on oxidative damage, levels of superoxide radicals, and ASC/DHA after HL stress. Arabidopsis seedlings (15 d old) from WT, Sil, and OE lines were treated under HL (T, 1000 μmol m−2 s−1) or under control conditions (C, 100 μmol m−2 s−1) for the indicated periods of time. (A) A time course for the oxidative damage of membranes, evidenced by ion leakage measurements, is shown for WT (dotted black lines), Sil lines (grey lines), and OE lines (black lines). Control treatment for WT plants only is shown (black squares); Sil and OE lines behaved similarly to the WT. Lines for both OE lines are superimposed. Data represent mean values ±SD from four biological replicas. (B and C) The superoxide radical levels (B) and the ASC/DHA ratios (C) were determined in WT (white bar), Sil lines (grey bars), and OE lines (black bars) under control conditions (C) and after 12 h of treatment with HL stress (T). Data represent mean values ±SD from four biological replicas. Statistical analysis was performed using paired Mann–Whitney test with the GraphPad Prism 5 program. Values that show statistically significant differences compared with the corresponding WT samples are indicated by asterisks (*P < 0.05, **P < 0.01, and ***P < 0.001).

Similar articles

Cited by

References

    1. Asada K. The water–water cycle in chloroplasts: scavenging of active oxygens and dissipation of excess photons. Annual Review of Plant Physiology and Plant Molecular Biology. 1999;50:601–639. - PubMed
    1. Asada K. The water–water cycle as alternative photon and electron sinks. Philosophical Transactions of the Royal Society B: Biological Sciences. 2000;355:1419–1430. - PMC - PubMed
    1. Asada K. Production and scavenging of reactive oxygen species in chloroplasts and their functions. Plant Physiology. 2006;141:391–396. - PMC - PubMed
    1. Asada K, Takahashi Y, Maeda Y, Enmanji K. Superoxide dismutases from a blue-green alga, Plectonema boryanum. Journal of Biological Chemistry. 1975;250:2801–2807. - PubMed
    1. Bandyopadhyay S, Gama F, Molina-Navarro MM, Gualberto JM, Claxton R, Naik SG, Huynh BH, Herrero E, Jacquot JP, Rouhier N. Chloroplast monothiol glutaredoxins as scaffold proteins for the assembly and delivery of [2Fe–2S] clusters. EMBO Journal. 2008;27:1122–1133. - PMC - PubMed

Publication types