. 2011 Sep;23(9):3260-75.
doi: 10.1105/tpc.111.088583. Epub 2011 Sep 30.

Molecular profiling of stomatal meristemoids reveals new component of asymmetric cell division and commonalities among stem cell populations in Arabidopsis

Affiliations

Molecular profiling of stomatal meristemoids reveals new component of asymmetric cell division and commonalities among stem cell populations in Arabidopsis

Lynn Jo Pillitteri et al. Plant Cell. 2011 Sep.

Abstract

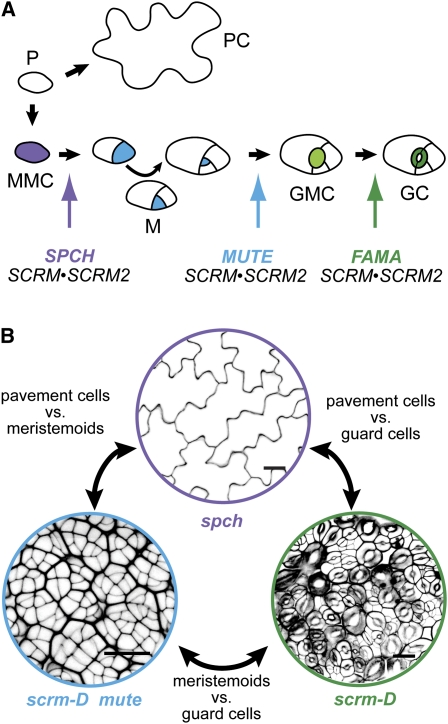
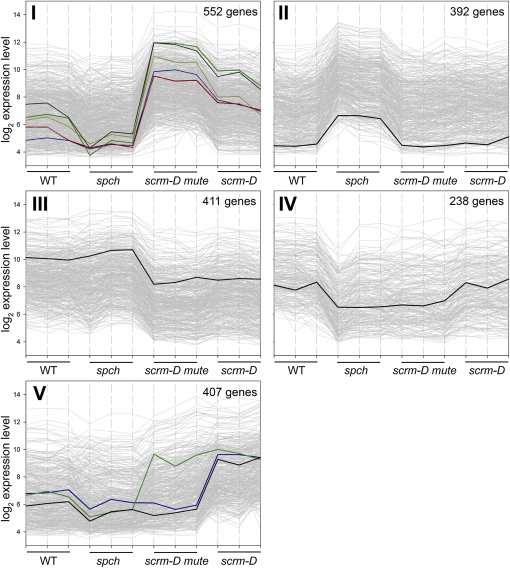
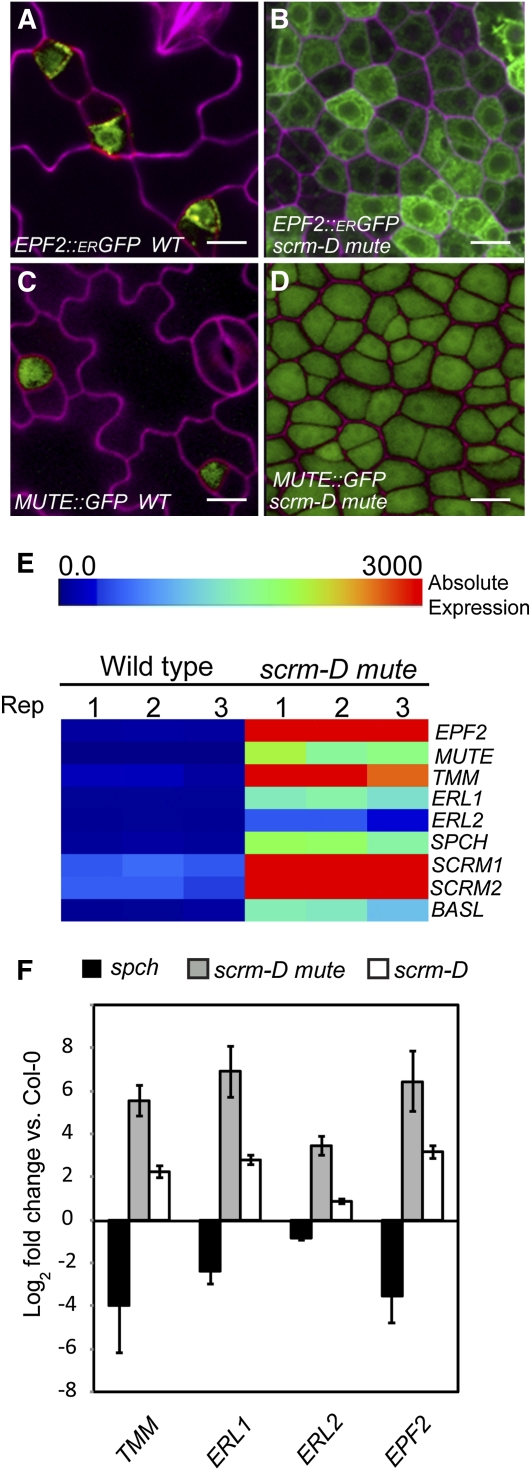
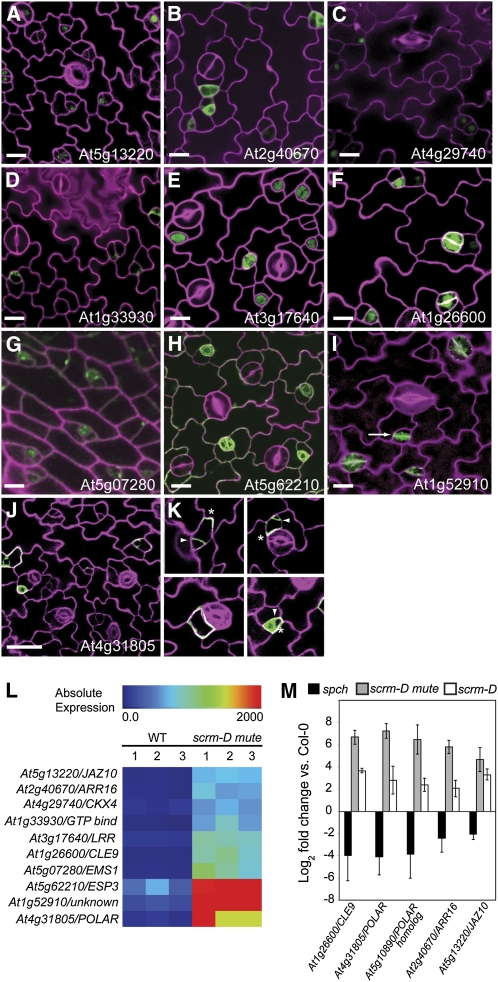
The balance between maintenance and differentiation of stem cells is a central question in developmental biology. Development of stomata in Arabidopsis thaliana begins with de novo asymmetric divisions producing meristemoids, proliferating precursor cells with stem cell-like properties. The transient and asynchronous nature of the meristemoid has made it difficult to study its molecular characteristics. Synthetic combination of stomatal differentiation mutants due to loss- or gain-of-function mutations in SPEECHLESS, MUTE, and SCREAM create seedlings with an epidermis overwhelmingly composed of pavement cells, meristemoids, or stomata, respectively. Through transcriptome analysis, we define and characterize the molecular signatures of meristemoids. The reporter localization studies of meristemoid-enriched proteins reveals pathways not previously associated with stomatal development. We identified a novel protein, POLAR, and demonstrate through time-lapse live imaging that it exhibits transient polar localization and segregates unevenly during meristemoid asymmetric divisions. The polar localization of POLAR requires BREAKING OF ASYMMETRY IN THE STOMATAL LINEAGE. Comparative bioinformatic analysis of the transcriptional profiles of a meristemoid with shoot and root apical meristems highlighted cytokinin signaling and the ERECTA family receptor-like kinases in the broad regulation of stem cell populations. Our work reveals molecular constituents of stomatal stem cells and illuminates a common theme among stem cell populations in plants.


Figures

Figure 1.
Figure 1.
Stomatal Cell Lineage Transitions and Cell Enrichment Strategy. (A) Diagram of the sequential cell state transitions during stomatal development specified by the combinatorial and sequential actions of the stomatal bHLH genes. A protodermal cell (P) can differentiate into a pavement cell (PC) or undergo a transition to become an MMC (purple). An MMC enters the stomatal lineage through an asymmetric division to create a meristemoid (M; blue). Meristemoids have transient stem cell–like properties that can undergo several rounds of amplifying divisions before differentiating into a GMC (light green). GMCs divide symmetrically to produce two GCs (dark green), which form a mature stoma. The point of action is indicated for each bHLH gene (colored arrows). (B) Strategy for comparing molecular signatures associated with each epidermal cell state/type. Images are of abaxial cotyledon epidermis of spch, scrm-D mute, and scrm-D mutant seedlings at 5 d after germination. Colors coincide with those described in (A). Bars = 10 μm.
Figure 2.
Figure 2.
K-Means Clustering of Genes Showing Differential Expression in Stomatal Differentiation Mutants. The log2 expression levels are plotted against the three replicates of each genotype (the wild type, spch, scrm-D mute, and scrm-D). Genes were prefiltered using the variance filter implemented in the MeV software to yield the 2000 genes showing highest variance across the 12 arrays. Cluster I: genes upregulated in scrm-D mute and to a lesser extent in scrm-D (meristemoid and GMC/GC enriched, respectively). Black, TMM; green, EPF2; red, ARR16; blue, CLE9; yellow, POLAR (At4g31805). WT, wild type. Cluster II: genes upregulated in spch (pavement cell–only epidermis). Highlighted in black is a representative gene (Orp4C, At5g57240) of this cluster. Cluster III: genes with reduced expression in scrm-D mute and scrm-D. Highlighted in black is IAA7 (At3g23050), which shows the representative expression pattern in this cluster. Cluster IV: genes expressed most strongly in the wild type and scrm-D. Highlighted in black is a representative gene (integral membrane family protein, At5g44550) of this cluster. Cluster V: genes upregulated in scrm-D (GMC/GC-enriched). Black, CHX20, a cation/H+ exchanger of GCs; blue, FAMA; green, EPF1.
Figure 3.
Figure 3.
Arrested Meristemoids Constituting the Epidermis of scrm-D mute Express Meristemoid Markers. EPF2 and MUTE promoter activity (green) is detected only in early stomatal lineage cells and not in mature stomata. Bars = 10 μm. (A) and (B) EPF2pro:erGFP (green) in the wild type (WT) (A) and scrm-D mute (B). (C) and (D) MUTEpro:GFP in the wild type (C) and scrm-D mute (D). Cell peripheries were highlighted with either propidium iodide or FM4-64 (magenta). (E) Known regulators of meristemoid development are highly expressed in scrm-D mute. Shown is a heat map showing the absolute expression levels in the wild type and scrm-D mute (meristemoid enriched). All three replicates are shown to demonstrate consistency. (F) qRT-PCR verification of a subset of stomatal regulators known to be expressed in meristemoids. Error bars represent the se (n = 3).
Figure 4.
Figure 4.
Localization in Stomatal Cell Lineages and Expression Levels. Genes represent those upregulated in the scrm-D mute background. All lines carry a C-terminal GFP protein fusion (green) of the indicated gene driven by its native promoter, except for CLE9 and EMS1, which carry the native promoter driving GFP. (A) to (K) Confocal images of wild-type seedling leaf epidermis. Images are of the abaxial surface, except (E) (adaxial surface). Cell peripheries were highlighted with either propidium iodide or FM4-64 (magenta). Arrow in (I) indicates cell plate. Asterisks in (K) indicate asymmetrical localization of At4g31805-GFP; arrowheads indicate location of division. Bars = 10 μm in (A) to (I) and 25 μm in (J). (L) Heat map representing the degree of upregulation of each indicated gene in scrm-D mute compared with the wild type. Three replicates are shown to demonstrate consistency. Scale represents absolute expression of each gene. (M) qRT-PCR verification of selected meristemoid-enriched genes identified in this study. Values are relative to expression of corresponding genes in the wild type. Error bars represent the se (n = 3).
Figure 5.
Figure 5.
Polar Localization of POLAR Precedes the Asymmetric Division of Stomatal Cell Lineages. Real-time imaging was performed using wild-type cotyledons expressing a C-terminal GFP protein fusion of POLAR driven by the native promoter (POLARpro:POLAR-GFP). Individual fields from imaging are shown over time as indicated ([A] to [K]). Cell membranes (magenta) are visualized with the mCherry plasma membrane marker pm-RB. POLAR-GFP displays localized, transient accumulation at the cell periphery distal to the plane of division prior to asymmetric divisions of stomatal cell lineage (MMC and meristemoids), then is redistributed following asymmetric division. Asterisk indicates polar localization. Arrowhead indicates the plane of division. SLGCs resulting from the asymmetric division are numbered (K). hpg, hours post germination. Bar = 20 μm. See also Supplemental Movie 1 online.
Figure 6.
Figure 6.
Localization of POLAR in the basl Mutant Defective in Asymmetric Division. Real-time imaging was performed using basl cotyledons expressing POLARpro:POLAR-GFP. Individual fields from imaging are shown over time as indicated ([A] to [H]). Loss-of-function basl mutants have diffuse peripheral POLAR-GFP expression that is not strongly polarized. Arrowheads indicate symmetrical division plane ([D] and [H]) relative to the parent cell. Asterisks indicate asymmetric division. hpg, hours postgermination. Bar = 20 μm. See also Supplemental Movie 2 online. [See online article for color version of this figure.]
Figure 7.
Figure 7.
Analysis of Cell Cycle Regulatory Gene Expression in the Stomatal Lineage. (A) to (D) All lines carry the GUS coding sequence driven by the native promoter of each indicated gene. Shown are differential interference contrast microscope images of abaxial leaf epidermis from wild-type seedlings expressing the following reporter lines: CDKB2;1, At1g76540 (A); CYCB1;2, At5g06150 (B); CYCA2;3, At1g15570 (C); and CYCA2;2, At5g11300 (D). Arrowheads indicate meristemoids; asterisks indicate GMCs; (+) indicates stomata. Bar = 10 μm. (E) Heat map representing the degree of upregulation of each indicated gene in the scrm-D mute background compared with the wild type. All three replicates of both genotypes are shown to demonstrate consistency. Scale represents absolute expression of each gene. (F) qRT-PCR of selected core cell cycle regulators in spch, scrm-D mute, and scrm-D. Gene names are indicated. Values are relative to the Col wild-type background. Error bars represent the se (n = 3).
Figure 8.
Figure 8.
Integrative Analysis of Transient and Permanent Stem Cell Populations. (A) and (B) Venn diagrams showing the distribution of unique and shared genes upregulated among scrm-D mute, CLV3, FIL, or WUS expressing cells (A) as well as among scrm-D mute and root tips zone1 and root tips (B). (C) qRT-PCR analysis showing that SCZ, a known regulator of asymmetric cell division within a root meristem, is highly upreguated in scrm-D mute and downregulated in spch. Error bars represent the se (n = 3). (D) and (E) Expression of SCZ promoter driving cyan fluorescent protein (CFP). SCZ promoter is active in stelar tissue within the root meristem (D) as well as in meristemoids (E). Bars = 10 μm in (D) and 20 μm in (E).

Similar articles

Cited by

References

    1. Abrash E.B., Bergmann D.C. (2009). Asymmetric cell divisions: A view from plant development. Dev. Cell 16: 783–796 - PubMed
    1. Benjamini Y., Hochberg Y. (1995). Controlling the false discovery rate: A practical and powerful approach to multiple testing. J. R. Stat. Soc. B 57: 289–300
    1. Bergmann D.C., Lukowitz W., Somerville C.R. (2004). Stomatal development and pattern controlled by a MAPKK kinase. Science 304: 1494–1497 - PubMed
    1. Bergmann D.C., Sack F.D. (2007). Stomatal development. Annu. Rev. Plant Biol. 58: 163–181 - PubMed
    1. Borner G.H., Sherrier D.J., Stevens T.J., Arkin I.T., Dupree P. (2002). Prediction of glycosylphosphatidylinositol-anchored proteins in Arabidopsis. A genomic analysis. Plant Physiol. 129: 486–499 - PMC - PubMed

Publication types

Associated data