. 2011 Nov;93(5):741-52.
doi: 10.1016/j.exer.2011.09.008. Epub 2011 Sep 24.

Accuracy and resolution of in vitro imaging based porcine lens volumetric measurements

Affiliations

Accuracy and resolution of in vitro imaging based porcine lens volumetric measurements

Mark Wendt et al. Exp Eye Res. 2011 Nov.

Abstract

There is considerable interest in determining lens volume in the living eye. Lens volume is of interest to understand accommodative changes in the lens and to size accommodative IOLs (A-IOLs) to fit the capsular bag. Some studies have suggested lens volume change during accommodation. Magnetic Resonance Imaging (MRI) is the only method available to determine lens volume in vivo. MRI is, by its nature, relatively low in temporal and spatial resolution. Therefore analysis often requires determining lens volume from single image slices with relatively low resolution on which only simple image analysis methods can be used and without repeated measures. In this study, 7 T MRI scans encompassing the full lens volume were performed on 19 enucleated pig eyes. The eyes were then dissected to isolate and photograph the lens in profile and the lens volumes were measured empirically using a fluid displacement method. Lens volumes were calculated from two- and three-dimensional (2D and 3D) MR and 2D photographic profile images of the isolated lenses using several different analysis methods. Image based and actual measured lens volumes were compared. The average image-based volume of all lenses varied from the average measured volume of all lenses by 0.6%-6.4% depending on the image analysis method. Image analysis methods that use gradient based edge detection showed higher precision with actual volumes (r(2): 0.957-0.990), while threshold based segmentation had poorer correlations (r(2): 0.759-0.828). The root-mean-square (RMS) difference between image analysis based volumes and fluid displacement measured volumes ranged from 8.51 μl to 25.79 μl. This provides an estimate of the error of previously published methods used to calculate lens volume. Immobilized, enucleated porcine eyes permit improved MR image resolution relative to living eyes and therefore improved image analysis methods to calculate lens volume. The results show that some of the accommodative changes in lens volume reported in the literature are likely below the resolution limits of imaging methods used. MRI, even with detailed image analysis methods used here, is unlikely to achieve the resolution required to accurately size an A-IOL to the capsular bag.


Figures

Figure 1
Figure 1
Pictorial representation of the methods used to analyze the image data. (A) In methods 2.3.1, several of the near-central slices were examined and volume was calculated from the slice with the greatest cross sectional area. (B) In method 2.3.2, a spherical transform was performed on the image stack. This diagram shows a sphere (left) and a spherical transform of the sphere (right). The surface of the sphere is shown in green, a segment of the sphere is shown in magenta, and the volume outside of the sphere is shown in yellow. In methods 2.3.3, (C) the lens edge is segmented in each slice of the image stack, (D) the Cartesian positions of the lens edges are interpolated and a polynomial fit around the edges to outline the entire lens surface, (E) then a 2D projection of the lens is used in methods 2.3.3.2 and 2.3.3.3. (F) Methods 2.4.1 use a profile image of the lens after the lens has been extracted from the eye. The methods depicted in A, E, and F result in 2D images which are converted to (G) binary images. Volume is calculated from these binary images by two methods: (H) in the sum of disks method, each row of lens pixels in the binary image is assumed to represent a cross-section of a disk and the pixels in all disks are summed; (I) using Pappus’ Theorem, the volume is calculated by treating the lens as an inflated torus.
Figure 2
Figure 2
Images of the lens from the same pig eye showing: (A) the most central slice from a stack of MR images, (B) the true central gray-scale interpolated image from the same 3-D stack of MR images, and (C) a profile image of the extracted lens after removal of the lens from the eye. Overlays show the lens edge overlays from volume calculations from these three images, respectively derived from (D) Method 2.3.1.1 on an MRI 2-D slice, (E) Method 2.3.2 applied to the whole MRI 3D stack, and (F) Method 2.4.1.1 applied to the extracted lens profile image.
Figure 3
Figure 3
Drawing shows the coordinate system used throughout this manuscript. (A) The lens in sagittal section showing the z-x plane. (B) The lens in equatorial section showing the x-y plane.
Figure 4
Figure 4
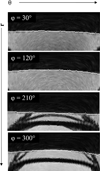
Sample images from the spherical transform method (Method 2.3.2). The interpolated 256 × 256 × 256 MRI stack has been spherically transformed into a 76 × 181 × 360 stack defined by the spherical coordinates, r, θ, and φ, respectively. Lens edges were found using the stack of r × θ images. Four of the sequence of 360 images are shown with detected lens edges marked in white and the value of φ for each image labeled in the corner. The upper darker region of each of these transformed images is the lens. The boundary between the lens and the anterior chamber, iris and vitreous chamber can be readily discerned as the edge marked in white.
Figure 5
Figure 5
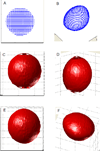
Interpolation and extrapolation of lens edges from Method 2.3.3.1. Edges found using the Canny edge detector are shown (A) in the x-y view and (B) in a 3D xyz view. Interpolation of these edges fills in the spaces between slices as shown (C) in the x-y view and (D) in a 3D xyz view. Lens edges were extrapolated with a 5th order polynomial to fill in the two y-ends of the lens as shown (E) in the x-y view and (F) in a 3D xyz view.
Figure 6
Figure 6
Calibration of the fluid displacement method for measuring lens volume using three acrylic ball bearings of known diameters. The volume of each ball was measured 5 times using the fluid displacement method. The standard deviations ranged from 0.0017g to 0.0041 g. Error bars showing standard deviations are on the graph, but are smaller than the symbols. The regression line shows a slope near one and an intercept near zero.
Figure 7
Figure 7
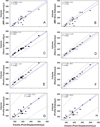
Plots of lens volumes derived from (A) Method 2.3.1.1, application of Pappus’s theorem to the central MRI 2-D slice, (B) Method 2.3.1.2, application of the sum of disks method to the central MRI 2-D slice, (C) Method 2.3.2, a spherical transform of the MRI 3-D stack, (D) Method 2.3.3.1, a Cartesian interpolation of the MRI 3-D stack, (E) Method 2.3.3.2, application of Pappus’s theorem to the central slice calculated from the Cartesian interpolation of the MRI 3-D stack, (F) Method 2.3.3.3, application of the sum of disks method to the central slice calculated from the Cartesian interpolation of the MRI 3D Stack, (G) Method 2.4.1.1, application of Pappus’s theorem to the extracted lens profile, (J) Method 2.4.1.2, application of the sum of disks method to the extracted lens profile image plotted against measured lens volumes from the fluid displacement method. Methods 2.3.1.1 and 2.3.1.2 show linear regression fits to the data because no standard deviations were available for each measurement. The rest show orthogonal regression fits to the data. Dashed lines indicate upper and lower confidence limits. The ideal one-to-one line is shown in blue.
Figure 8
Figure 8
Error in the volume calculated from the 2D projected images of a 3D simulated lens that was systematically tilted in the y-z plane. The solid horizontal line indicates the actual volume in calibrated units of the simulated 3D lens.
Figure 9
Figure 9
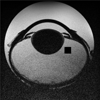
Demonstration of the extent of error in the measured volumes drawn into the central slice of a stack of pig lens MR images. The black square adjacent to the lens represents a cube with sides of length 2.04 mm. This is the 2D equivalent of an error in the lens volume of 8.51 µl which is the same as the RMS of the differences in volume between Method 2.3.2 (spherical transform of the image stack) and fluid displacement measured lens volumes. This lens had a fluid displacement measured volume of 389 µl.

Similar articles

Cited by

References

    1. Atchison DA, Markwell EL, Kasthurirangan S, Pope JM, Smith G, Swann PG. Age-related changes in optical and biometric characteristics of emmetropic eyes. J Vis. 2008;8 29-20. - PubMed
    1. Augusteyn RC. Growth of the human eye lens. Mol. Vis. 2007;13:252–257. - PMC - PubMed
    1. Baikoff G, Lutun E, Wei J, Ferraz C. Anterior chamber optical coherence tomography study of human natural accommodation in a 19-year-old albino. J. Cataract Refract. Surg. 2004;30:696–701. - PubMed
    1. Borja D, Manns F, Ho A, Ziebarth NM, Acosta AC, Arrieta-Quintera E, Augusteyn RC, Parel JM. Refractive power and biomethc properties of the nonhuman primate isolated crystalline lens. Invest Ophthalmol Vis Sci. 2010a;51:2118–2125. - PMC - PubMed
    1. Borja D, Siedlecki D, de Castro A, Uhlhorn S, Ortiz S, Arrieta E, Parel JM, Marcos S, Manns F. Distortions of the posterior surface in optical coherence tomography images of the isolated crystalline lens: effect of the lens index gradient. Biomed. Opt. Express. 2010b;1:1331–1340. - PMC - PubMed

Publication types