. 2011 Nov 1;187(9):4705-13.
doi: 10.4049/jimmunol.1100794. Epub 2011 Sep 30.

NKT TCR recognition of CD1d-α-C-galactosylceramide

Affiliations

NKT TCR recognition of CD1d-α-C-galactosylceramide

Onisha Patel et al. J Immunol. .

Abstract

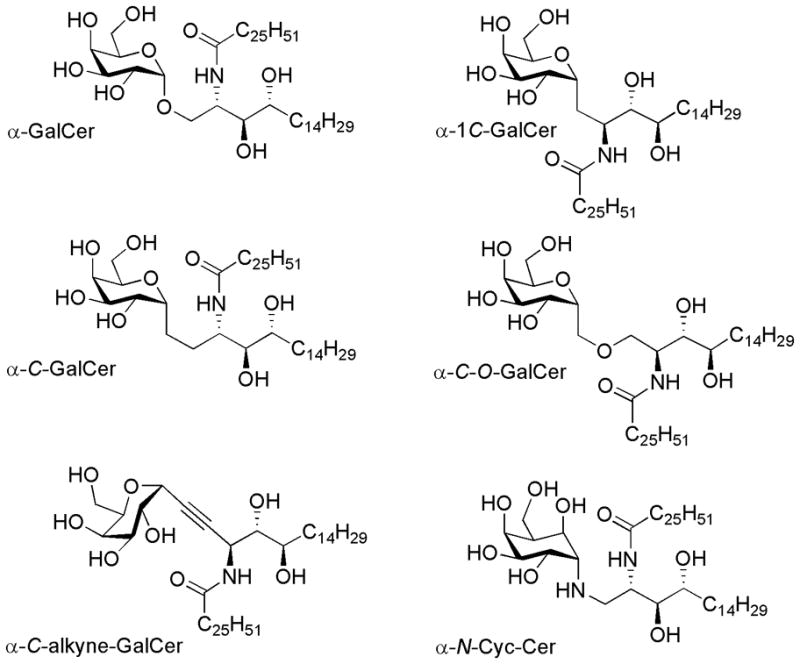
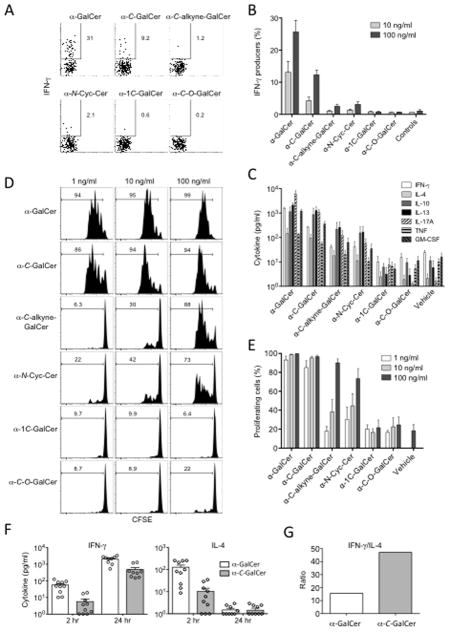
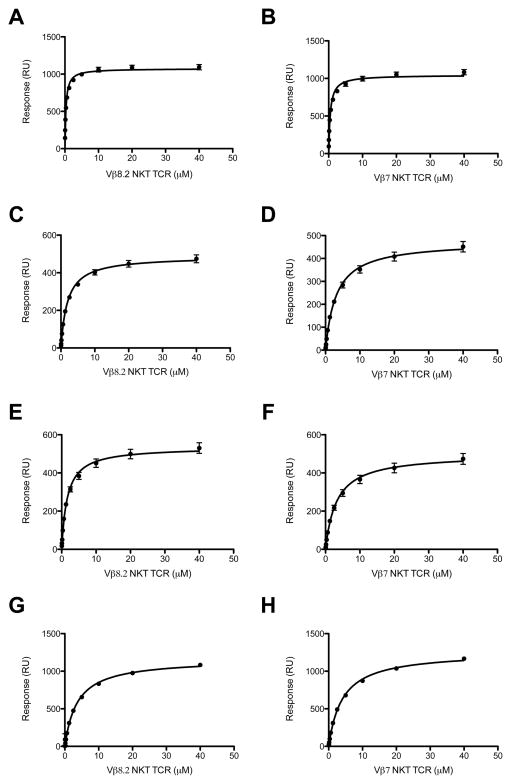
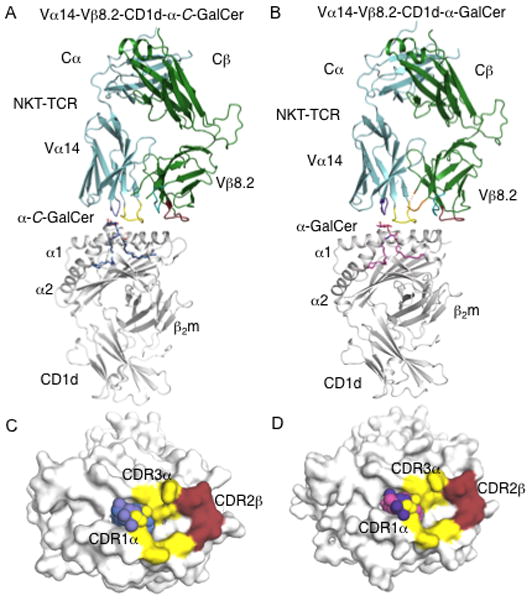
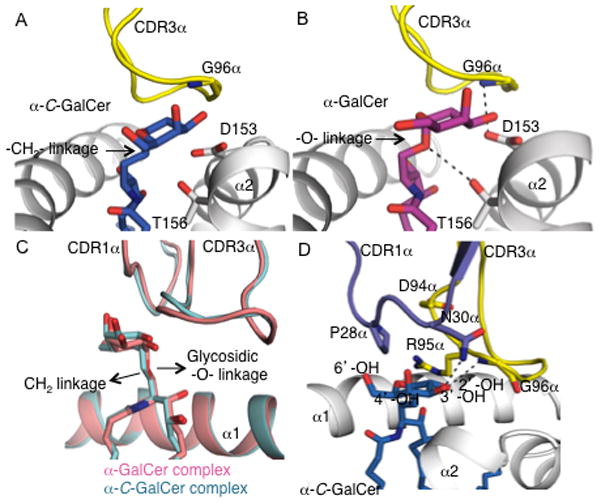
NKT cells respond to a variety of CD1d-restricted glycolipid Ags that are structurally related to the prototypic Ag α-galactosylceramide (α-GalCer). A modified analog of α-GalCer with a carbon-based glycosidic linkage (α-C-GalCer) has generated great interest because of its apparent ability to promote prolonged, Th1-biased immune responses. In this study, we report the activation of spleen NKT cells to α-C-GalCer, and related C-glycoside ligands, is weaker than that of α-GalCer. Furthermore, the Vβ8.2 and Vβ7 NKT TCR affinity for CD1d-α-C-GalCer, and some related analogs, is ∼10-fold lower than that for the NKT TCR-CD1d-α-GalCer interaction. Nevertheless, the crystal structure of the Vβ8.2 NKT TCR-CD1d-α-C-GalCer complex is similar to that of the corresponding NKT TCR-CD1d-α-GalCer complex, although subtle differences at the interface provide a basis for understanding the lower affinity of the NKT TCR-CD1d-α-C-GalCer interaction. Our findings support the concept that for CD1d-restricted NKT cells, altered glycolipid ligands can promote markedly different responses while adopting similar TCR-docking topologies.


Figures

FIGURE 1
FIGURE 1. Structures of the glycolipid Ags used
α-GalCer, α-C-GalCer, α-1C-GalCer, α-C-alkyne-GalCer, α-C-O-GalCer, α-N-Cyc-Cer.
FIGURE 2
FIGURE 2. In vitro stimulation of spleen NKT cells with α-C-GalCer and associated analogues
Spleen cells were cultured with 100, 10, and 1 ng/ml of the glycolipids as indicated. A. After 8 hours, cell cultures were harvested and surface labelled with anti-TCR-β and α-GalCer-loaded CD1d tetramer then fixed and permeabilised for ICS for IFN-γ production. B. The mean ± SEM from three independent experiments testing IFN-γ production by ICS (as per A) are shown. C. Cytokine production at 72 hours from spleen cells cultured with the various analogues was determined by cytometric bead array. The mean ± SEM from three independent experiments are shown. The exception is IL-10, which was only measured in 2 experiments. D. Representative data showing the proliferation of NKT cells in response to the different ligands as determined by CFSE labelled spleen cells, gating on α-GalCer-CD1d tetramer + cells after 72 hr. E. The CFSE proliferation results for NKT cells (as depicted in C) from four independent experiments (mean ± SEM) are shown. F. Cytokines detected in the serum of mice determined by cytometric bead array following the i.p. administration of 1 μg of glycolipid. The combined results from three independent experiments (10 mice per group) are shown. G. The ratio of serum IFN-γ (24 hr) to serum IL-4 (2 hr). For B, C and E, the data readings for each individual experiment were the mean of duplicate cultures. Error bars represent SEM.
FIGURE 3
FIGURE 3. Binding analysis of Vβ8.2 and Vβ7 to CD1d-Ag
Equilibrium binding response curve for Vβ8.2 TCR to CD1d-α-GalCer (A), CD1d-α-C-GalCer (C), CD1d-α-C-alkyne-GalCer (E) and CD1d-α-N-Cyc-Cer (G) and Vβ7 TCR to CD1d-α-GalCer (B), CD1d-α-C-GalCer (D), CD1d-α-C-alkyne-GalCer (F) and CD1d-α-N-Cyc-Cer (H). The equilibrium dissociation constant (KDeq) by fitting to one-site binding model. All results are shown as one experiment performed in triplicate (representative of 2–3 experiments).
FIGURE 4
FIGURE 4. Structure of Vα14-Vβ8.2 NKT TCRs in complex with CD1d-α-C-GalCer
(A)Vα14-Vβ8.2 NKT TCR in complex with CD1d-α-C-GalCer. α-C-GalCer, blue; CD1d heterodimer, grey; Vα14, cyan; Vβ8.2, green. CDR1α, purple; CDR3α, yellow; CDR1β, teal; CDR2β, ruby; CDR3β, not modelled. B, Vα14-Vβ8.2 NKT TCR in complex with CD1d-α-GalCer. α-GalCer, magenta; CDR3β, orange; CD1d, Vα14, Vβ8.2, CDR1α, CDR3α, CDR1β, CDR2β colour coding as in A. C, Footprint of Vα14-Vβ8.2 on the surface of CD1d-α-C-GalCer. α-C-GalCer is shown in spheres. CD1d, α-C-GalCer and CDR loops colour coding as in A. D, footprint of Vα14-Vβ8.2 on the surface of CD1d-α-GalCer. CD1d, α-GalCer and CDR loops colour coding as in A and B.
FIGURE 5
FIGURE 5. Vα14-Vβ8.2 NKT TCR mediated interactions with mouse CD1d-glycolipid interface
A, Vα14-Vβ8.2 NKT TCR CDR3α and mCD1d mediated contacts with α-C-GalCer. α-C-GalCer, blue; CDR3α, yellow; CD1d, grey. B, Vα14-Vβ8.2 NKT TCR CDR3α and CD1d mediated contacts with α-GalCer. α-GalCer, magenta; CDR3α, and mCD1d colour coding as in A. H-bonds are shown in black dashed lines. C, superposition of mouse Vα14-Vβ8.2 NKT TCR-CD1d-α-C-GalCer and Vα14-Vβ8.2 NKT TCR-CD1d-α-GalCer complexes. Vα14Vβ8.2 NKT TCR-CD1d-αC-GalCer is shown in cyan and Vα14-Vβ8.2 NKT TCR-CD1d-α-GalCer is shown in pink. The replacement of the glycosidic -O- linkage in α-GalCer to a hydrophobic -CH2- linkage in α-C-GalCer does not result in a major head group movement. D, Vα14-Vβ8.2 NKT TCR CDR1α and CDR3α mediated contacts with α-C-GalCer. α-C-GalCer, blue; CDR1α, purple; CDR3α, yellow; mCD1d, grey. H-bonds are shown in black dashed lines.

Similar articles

Cited by

References

    1. Godfrey DI, MacDonald HR, Kronenberg M, Smyth MJ, Van Kaer L. NKT cells: what’s in a name? Nat Rev Immunol. 2004;4:231–237. - PubMed
    1. Bendelac A, Savage PB, Teyton L. The Biology of NKT Cells. Annu Rev Immunol. 2007;25:297–336. - PubMed
    1. Wingender G, Rogers P, Batzer G, Lee MS, Bai D, Pei B, Khurana A, Kronenberg M, Horner AA. Invariant NKT cells are required for airway inflammation induced by environmental antigens. The Journal of Experimental Medicine. 208:1151–1162. - PMC - PubMed
    1. Brigl M, Tatituri RVV, Watts GFM, Bhowruth V, Leadbetter EA, Barton N, Cohen NR, Hsu F-F, Besra GS, Brenner MB. Innate and cytokine-driven signals, rather than microbial antigens, dominate in natural killer T cell activation during microbial infection. The Journal of Experimental Medicine. 208:1163–1177. - PMC - PubMed
    1. Cerundolo V, Silk JD, Masri SH, Salio M. Harnessing invariant NKT cells in vaccination strategies. Nat Rev Immunol. 2009;9:28–38. - PubMed

Publication types

MeSH terms

Associated data