. 2011 Oct 2;29(10):928-33.
doi: 10.1038/nbt.1977.

Tracking single hematopoietic stem cells in vivo using high-throughput sequencing in conjunction with viral genetic barcoding

Affiliations

Tracking single hematopoietic stem cells in vivo using high-throughput sequencing in conjunction with viral genetic barcoding

Rong Lu et al. Nat Biotechnol. .

Abstract

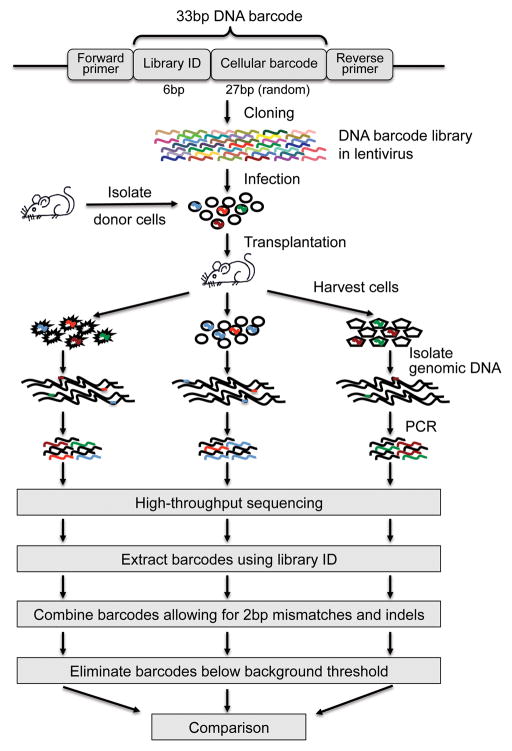
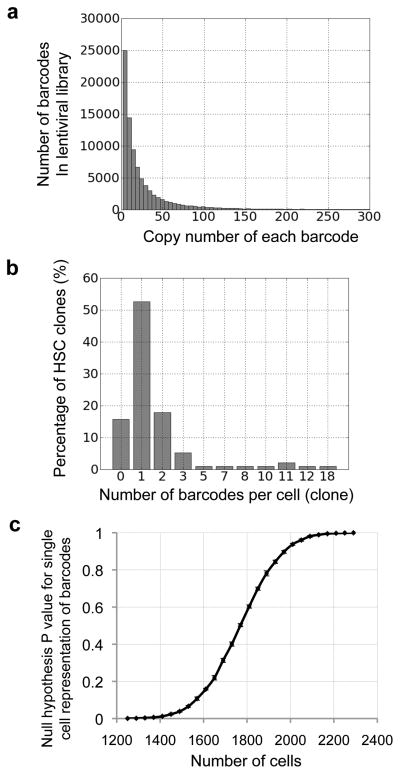
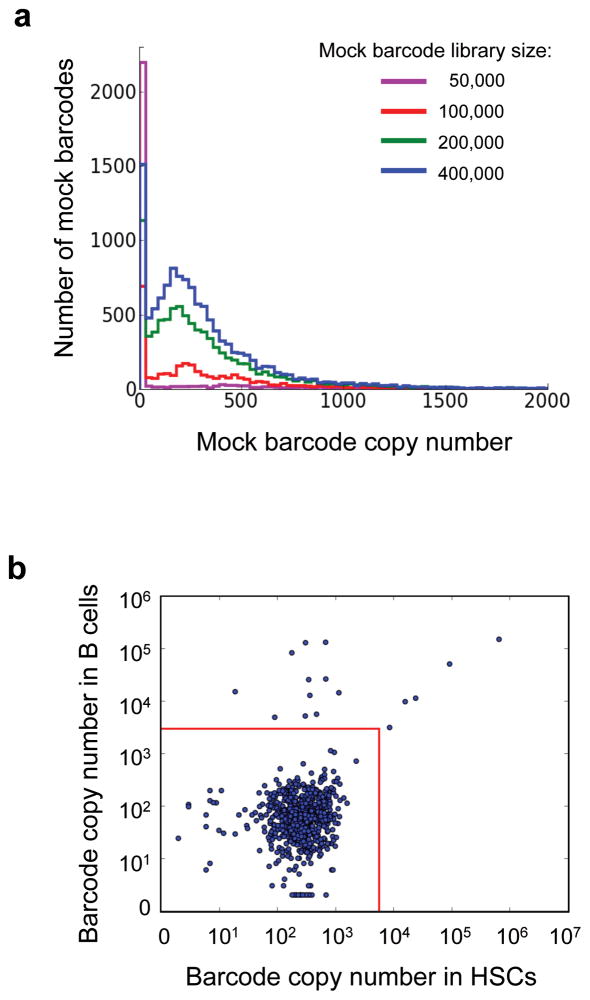
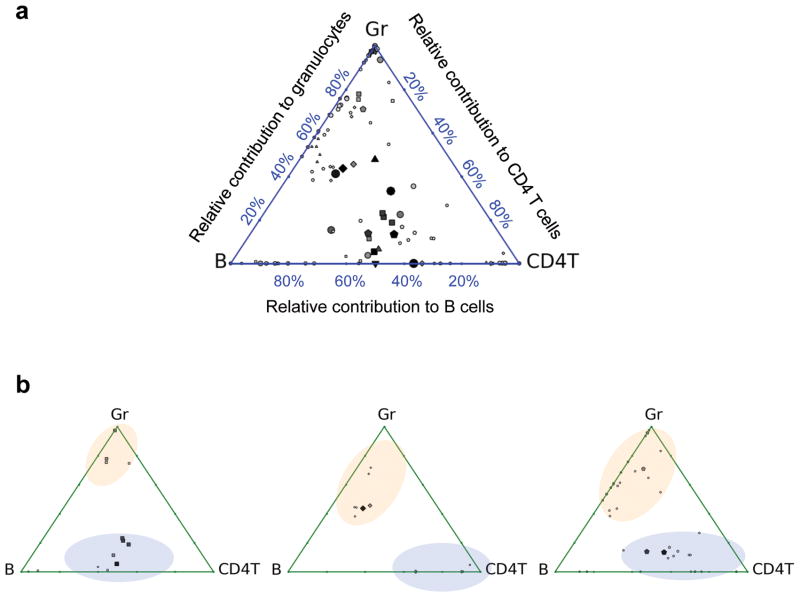
Disentangling cellular heterogeneity is a challenge in many fields, particularly in the stem cell and cancer biology fields. Here we demonstrate how to combine viral genetic barcoding with high-throughput sequencing to track single cells in a heterogeneous population. We use this technique to track the in vivo differentiation of unitary hematopoietic stem cells (HSCs). The results are consistent with single-cell transplantation studies but require two orders of magnitude fewer mice. In addition to its high throughput, the high sensitivity of the technique allows for a direct examination of the clonality of sparse cell populations such as HSCs. We show how these capabilities offer a clonal perspective of the HSC differentiation process. In particular, our data suggest that HSCs do not equally contribute to blood cells after irradiation-mediated transplantation, and that two distinct HSC differentiation patterns co-exist in the same recipient mouse after irradiation. This technique can be applied to any virus-accessible cell type for both in vitro and in vivo processes.


Figures

Figure 1
Figure 1
Experimental workflow. A DNA barcode consists of a common 6bp library ID at the 5′ end followed by a random 27bp cellular barcode. In the figure, different colors represent different barcode sequences. A lentiviral vector delivers a large library of barcodes into a small number of cells such that each cell receives a unique barcode. Barcodes replicate with the cells in the recipient mice after transplantation. Afterwards, the progeny of the donor cells are harvested. Barcodes are recovered from the genomic DNA using PCR and analyzed using high throughput sequencing (Illumina GA II). The 6bp library ID helps to identify barcodes in the sequencing result. Identical 33bp barcodes are combined allowing for mismatches and indels up to 2bp in total. The barcodes are then compared across different cell populations that originate from the same starting cell population.
Figure 2
Figure 2
DNA barcode library and delivery. (a) Histogram displaying barcode copy numbers from a lentiviral library. Additional lentiviral libraries are shown in Supplementary Fig. 1, together with the negative controls to demonstrate the level of background noise for this experiment. (b) Histogram showing the number of barcode(s) that each HSC clone receives after infection. 95 HSC clones were examined in total. This distribution fits a normal distribution shown in Supplementary Fig. 3. (c) Monte Carlo simulation of the null hypothesis that more than 95% of the barcodes represent single cells. The P value is plotted against the size of the cell population whose barcodes are recovered in the result.
Figure 3
Figure 3
Background noise sequences. (a) Background noise sequences without the expected 6bp library IDs. Sequences with identical 6bp at the 5′ end are clustered. Mock barcode libraries are constructed from clustered sequences whose initial 6bp are not among the expected library IDs. Mock barcodes from 20 mock barcode libraries are plotted as one line to demonstrate their copy number distribution. Different lines display the mock barcode libraries with different sizes. (b) Log scale plot of barcode copy numbers in HSCs and in B cells from one irradiated mouse transplanted with 1000 donor HSCs. Each dot represents a distinct barcode. Barcodes with copy numbers below 1000 appear randomly in the two cell populations whereas barcodes with copy numbers higher than 10,000 form a distinct pattern. Red lines illustrate background thresholds as calculated by our algorithm.
Figure 4
Figure 4
Lineage bias of HSC differentiation after irradiation. Triangle plots show the relative proportion of barcodes in granulocytes (Gr), B cells (B) and CD4+ T cells (CD4T) 22 weeks after lethal irradiation mediated transplantation. Each dot within the triangle represents a distinct barcode. Bigger and darker dots represent more abundant barcodes. The distance of a dot to the three vertices of the triangle is inversely correlated with the relative abundance of the barcode within the particular cell populations. For example, if a barcode is only found in one cell population, the dot is plotted at the corresponding vertex; if a barcode appears equally in all three populations, the dot is plotted in the middle of the triangle. (a) Barcodes from seven mice are plotted in one triangle. The barcodes from each mouse are represented by a particular shape: circle, square, triangle pointing up, triangle pointing down, diamond, pentagon, and octagon. (b) Each triangle plot depicts a single mouse. Distinct barcode groups are highlighted with blue and orange ellipses. Plots for all the seven mice are shown in Supplementary Fig. 7.
Figure 5
Figure 5
Clonal correlations of hematopoietic populations. Pearson correlation coefficients of barcode representations (copy numbers) are calculated to quantify the clonal correlations. The colors are assigned based on the mean correlations from seven mice. Raw data for individual mouse are shown in Supplementary Table 4. (a) Clonal correlations of extracted hematopoietic populations. (b) Clonal correlations of the hematopoietic populations compared with HSCs. (c) Clonal correlations of the hematopoietic populations compared with granulocyte/monocytic progenitor (GMP). Pearson correlations coefficient values are labeled for MEP and CLP to highlight the difference. (b–c) The circles and arrows were arranged based on the general model of hematopoiesis to depict the developmental relationships of the hematopoietic populations,,,,. Abbreviations: hematopoietic stem cell (HSC), Flk2− multipotent progenitor (MPP/Flk2−), Flk2+ multipotent progenitor (MPP/Flk2+), granulocyte/monocytic progenitor (GMP), megakaryotic/erythroid progenitor (MEP), common lymphocyte progenitor (CLP), granulocyte (Gr), B cell (B), CD4 T cells (CD4T) and CD8 T cells (CD8T).

Comment in

References

    1. Weissman IL. Stem cells: units of development, units of regeneration, and units in evolution. Cell. 2000;100:157–168. S0092-8674(00)81692-X [pii] - PubMed
    1. Blanpain C, Horsley V, Fuchs E. Epithelial stem cells: turning over new leaves. Cell. 2007;128:445–458. doi: 10.1016/j.cell.2007.01.014. S0092-8674(07)00070-0 [pii] - DOI - PMC - PubMed
    1. Snippert HJ, Clevers H. Tracking adult stem cells. EMBO Rep. 2011;12:113–122. doi: 10.1038/embor.2010.216. embor2010216 [pii] - DOI - PMC - PubMed
    1. Seita J, Weissman IL. Hematopoietic stem cell: self-renewal versus differentiation. Wiley Interdiscip Rev Syst Biol Med. 2010;2:640–653. doi: 10.1002/wsbm.86. - DOI - PMC - PubMed
    1. Bryder D, Rossi DJ, Weissman IL. Hematopoietic stem cells: the paradigmatic tissue-specific stem cell. Am J Pathol. 2006;169:338–346. doi: 10.2353/ajpath.2006.060312. S0002-9440(10)62717-4 [pii] - DOI - PMC - PubMed

Publication types

MeSH terms