. 2011 Nov;25(11):1936-49.
doi: 10.1210/me.2011-1124. Epub 2011 Sep 29.

Myostatin induces degradation of sarcomeric proteins through a Smad3 signaling mechanism during skeletal muscle wasting

Affiliations

Myostatin induces degradation of sarcomeric proteins through a Smad3 signaling mechanism during skeletal muscle wasting

Sudarsanareddy Lokireddy et al. Mol Endocrinol. 2011 Nov.

Erratum in

  • Erratum.
    [No authors listed] [No authors listed] Mol Endocrinol. 2015 Jan;29(1):153. doi: 10.1210/me.2014-1357. Mol Endocrinol. 2015. PMID: 25549158 Free PMC article. No abstract available.

Retraction in

  • Retraction.
    [No authors listed] [No authors listed] Mol Endocrinol. 2016 Feb;30(2):274. doi: 10.1210/me.2015-1318. Epub 2016 Jan 8. Mol Endocrinol. 2016. PMID: 26745670 Free PMC article. No abstract available.

Abstract

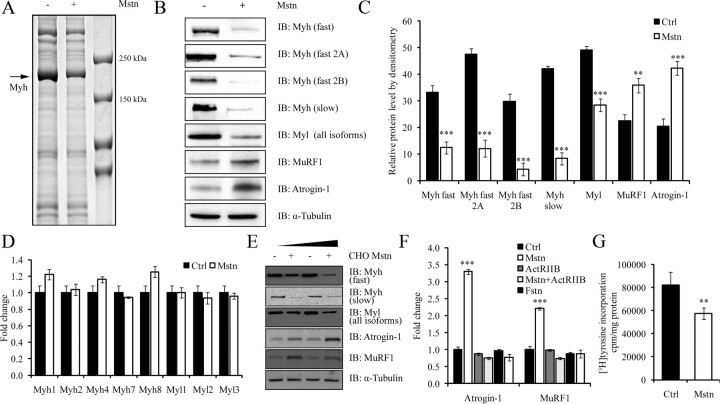
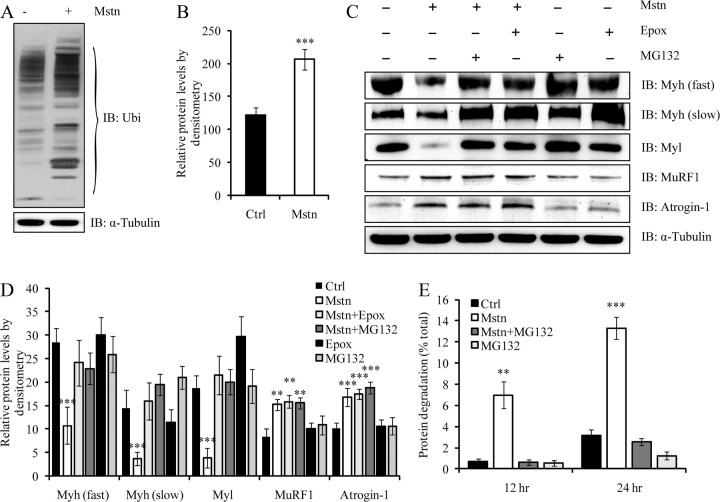
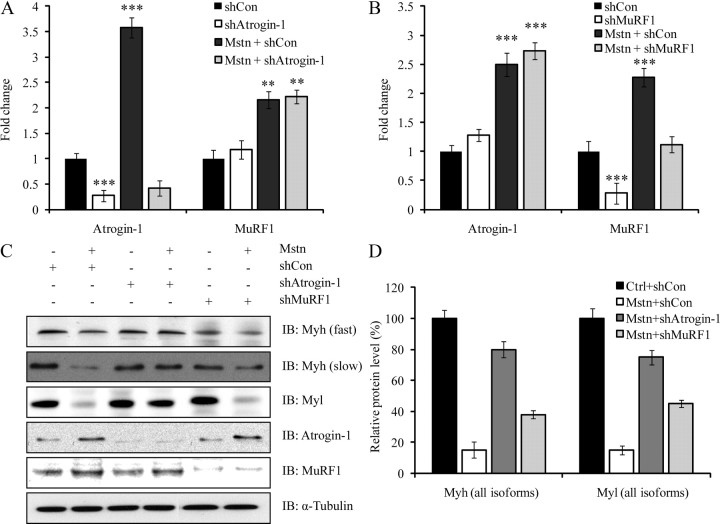
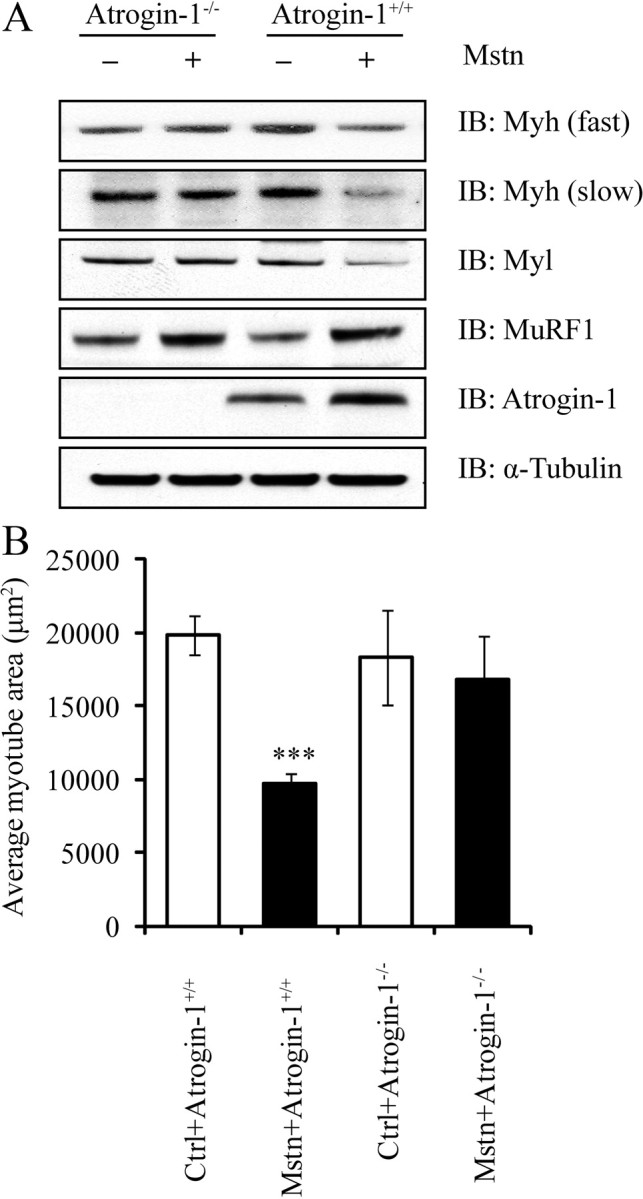
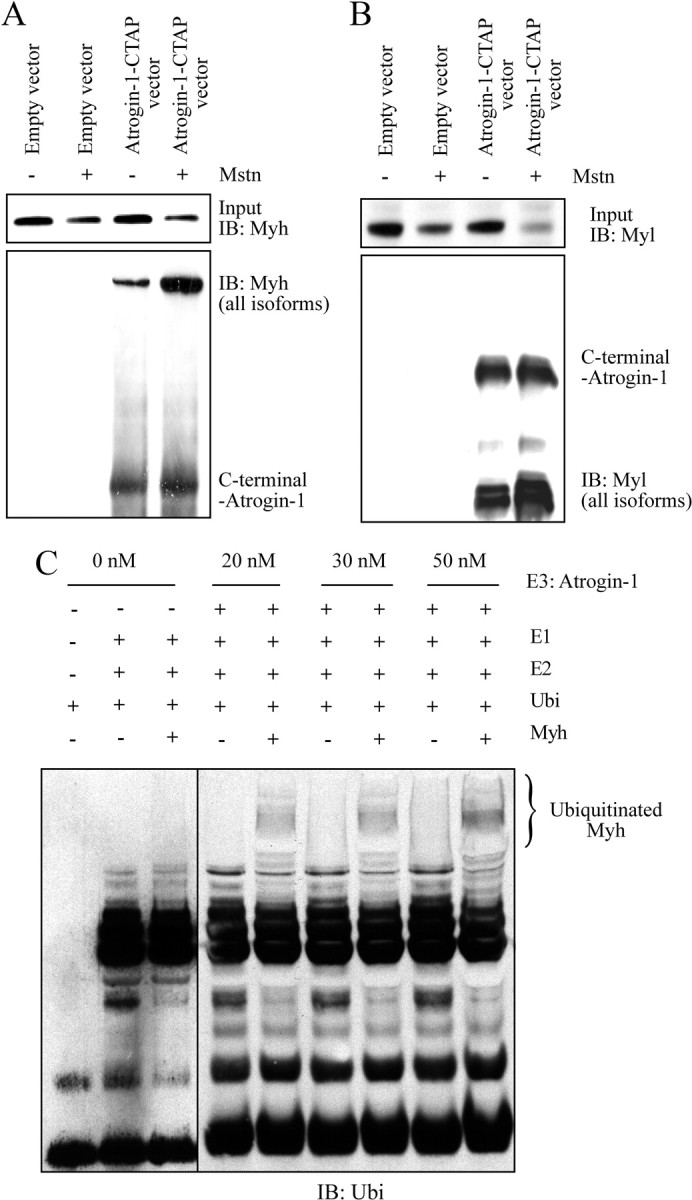
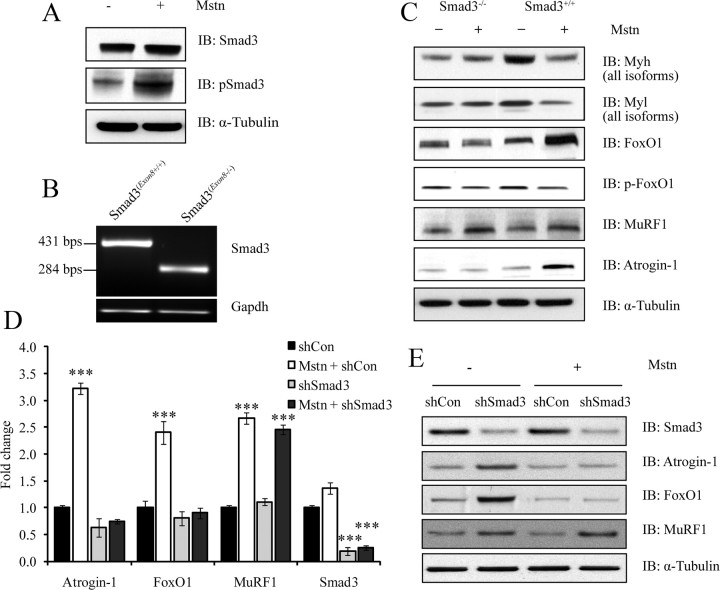
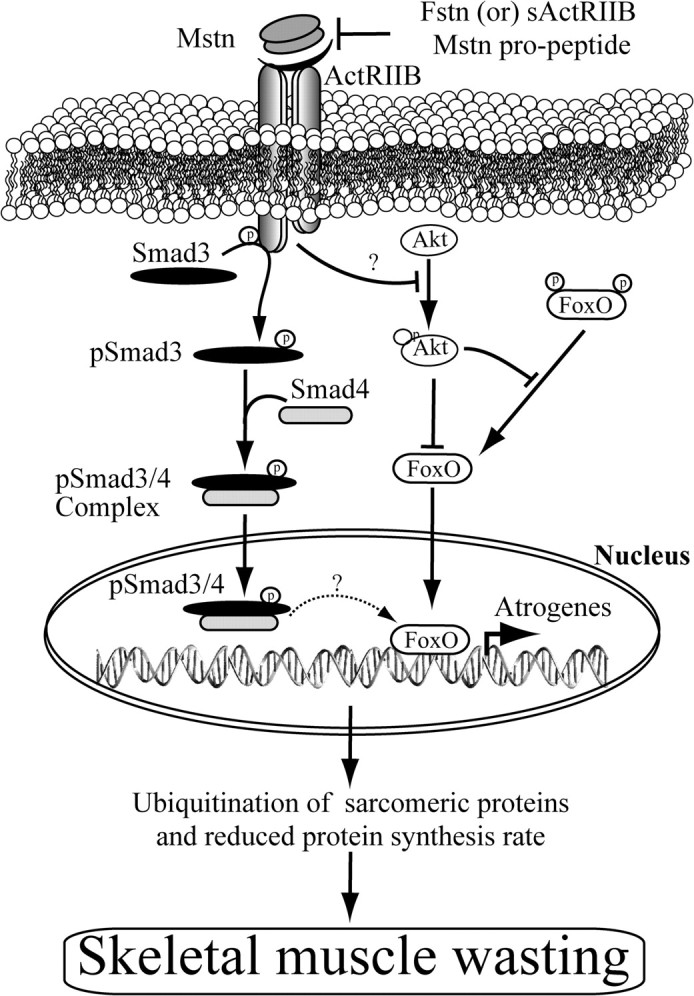
Ubiquitination-mediated proteolysis is a hallmark of skeletal muscle wasting manifested in response to negative growth factors, including myostatin. Thus, the characterization of signaling mechanisms that induce the ubiquitination of intracellular and sarcomeric proteins during skeletal muscle wasting is of great importance. We have recently characterized myostatin as a potent negative regulator of myogenesis and further demonstrated that elevated levels of myostatin in circulation results in the up-regulation of the muscle-specific E3 ligases, Atrogin-1 and muscle ring finger protein 1 (MuRF1). However, the exact signaling mechanisms by which myostatin regulates the expression of Atrogin-1 and MuRF1, as well as the proteins targeted for degradation in response to excess myostatin, remain to be elucidated. In this report, we have demonstrated that myostatin signals through Smad3 (mothers against decapentaplegic homolog 3) to activate forkhead box O1 and Atrogin-1 expression, which further promotes the ubiquitination and subsequent proteasome-mediated degradation of critical sarcomeric proteins. Smad3 signaling was dispensable for myostatin-dependent overexpression of MuRF1. Although down-regulation of Atrogin-1 expression rescued approximately 80% of sarcomeric protein loss induced by myostatin, only about 20% rescue was seen when MuRF1 was silenced, implicating that Atrogin-1 is the predominant E3 ligase through which myostatin manifests skeletal muscle wasting. Furthermore, we have highlighted that Atrogin-1 not only associates with myosin heavy and light chain, but it also ubiquitinates these sarcomeric proteins. Based on presented data we propose a model whereby myostatin induces skeletal muscle wasting through targeting sarcomeric proteins via Smad3-mediated up-regulation of Atrogin-1 and forkhead box O1.


Figures

Fig. 1.
Fig. 1.
Myostatin induces the loss of sarcomeric proteins and protein synthesis machinery during myotubular atrophy. A, A micrograph showing a Coomassie blue-stained SDS-PAGE. The molecular weight marker is indicated in lane-3 (from left). Protein lysates from myostatin treated (+) or untreated myotubes (−) are shown. The arrow indicates an approximately 200 kDa protein which is reduced after myostatin treatment. The molecular mass (kDa) of the protein is similar to that of Myh. B, Analysis of Myh and Myl isoforms by immunoblotting (IB). First panel, Myh fast type 2 isoforms; Second panel, Myh fast 2A; Third panel, Myh fast 2B, fourth panel, Myh slow; and fifth panel, Myl (all isoforms). The sixth and seventh panels refer to MuRF1 and Atrogin-1, respectively. The levels of α-tubulin were assessed to ensure equal loading. C, Densitometric analysis of Myh (all isoforms), Myl (all isoforms), MuRF1, and Atrogin-1. P < 0.01 (**) and P < 0.001 (***) and error bars represent the mean ± sd from three replicate experiments. D, Real time-qPCR analysis of individual isoforms of Myh and Myl from untreated (Ctrl) and myostatin-treated (Mstn) myotubes. E, Differentiated C2C12 myotubes were treated with conditioned media containing eukaryotic produced CHO-cell secreted myostatin (10 and 20 ng, as estimated by ELISA) with the protein extracts subjected to IB analysis with Myh fast antibody (first panel), Myh slow antibody (second panel), and an antibody that detects all isoforms of Myl (third panel). The fourth and fifth panels depict Atrogin-1 and MuRF1 protein levels, respectively. The levels of α-tubulin were assessed to ensure equal loading. F, Real time-qPCR analysis of mRNA expression of Atrogin-1 and MuRF1 in the presence or absence of recombinant myostatin (Mstn), soluble ActRIIB (ActRIIB) and follistatin (Fstn). The graph depicts the mean fold change in gene expression and is representative of triplicate experiments. P < 0.001 (***) and error bars represent the mean ± sd. G, Mstn suppresses protein synthesis in differentiated myotubes. After 24 h of treatment with Mstn, myotubes were incubated with [3H]tyrosine for 2 h. The radioactivity incorporated was measured and normalized to total protein lysate. P < 0.01 (**), and error bars represent the mean ± sd. Ctrl, Control.
Fig. 2.
Fig. 2.
Myostatin treatment results in increased ubiquitination and proteasome-dependent degradation of sarcomeric proteins. C2C12 myotubes were differentiated and treated with myostatin. A, Sarcomeric protein-enriched fraction was analyzed by immunoblotting using specific anti-ubiquitin (Ubi) antibodies. The top panel displays total ubiquitinated proteins in myostatin treated (+) and untreated (−) protein lysates. The levels of α-tubulin were assessed to ensure equal loading. B, Densitometric analysis of ubiquitinated proteins, displayed as mean relative protein level from two replicate experiments. P < 0.001 (***) and the error bars represent mean of ± sd. C, Immunoblotting (IB) analysis of Myh isoforms (fast and slow), Myl (all isoforms), MuRF1, and Atrogin-1 after treatment with (+) or without (−) myostatin in the presence (+) or absence (−) of either Epox or MG132. The levels of α-tubulin were assessed to ensure equal loading. D, Densitometry analysis of IB for Myh (fast and slow), Myl (all isoforms), Atrogin-1, and MuRF1, normalized to α-tubulin. The error bars represent mean ± sd from three independent experiments. E, Myostatin increases proteolysis in differentiated myotubes. Differentiated myotubes were incubated with [3H]tyrosine for 36 h and then treated with Mstn or MG132 or a combination of both. Media were collected at 12 and 24 h, and the amount of degraded [3H]tyrosine-labeled protein was expressed as a percentage of the initial amount of [3H]tyrosine added. Statistical significance was assessed. P < 0.01 (**) and P < 0.001 (***). Ctrl, Control.
Fig. 3.
Fig. 3.
Myostatin-induced sarcomeric protein degradation occurs preferentially through Atrogin-1. Myoblasts were transfected with control shRNA (shCon) or shAtrogin-1 or shMuRF1 expressing pSilencer constructs. Stable knockdown myotube cultures were differentiated for 3 d and treated with (+) or without (−) myostatin. A, Real time-qPCR analysis of Atrogin-1 and MuRF1 expression in Atrogin-1 knockdown cells after myostatin treatment. B, Real time-qPCR analysis of Atrogin-1, and MuRF1 expression in MuRF1 knockdown cells after myostatin treatment. Graphs display mean fold changes and are representative of three replicate plates. Each mRNA expression level was determined relative to the mean expression level of mRNA in control cells. P < 0.01 (**), P < 0.001 (***), and error bars represent ± sd. C, Immunoblotting (IB) analysis of Atrogin-1, MuRF1, Myh (fast and slow) and Myl expression in Atrogin-1 and MuRF1 shRNA knockdown cells after treatment with (+) or without (−) myostatin. The levels of α-tubulin were assessed to ensure equal loading. D, Densitometric analysis of IB for Myh and Myl isoforms after treatment with or without myostatin (Mstn) in shCon-, shAtrogin-1-, and shMuRF1-transfected myotubes. The relative protein level (%) was calculated by normalizing the control (shCon) to 100%. The data have been generated from four independent experiments. Error bars represent mean ± sd. Ctrl, Control.
Fig. 4.
Fig. 4.
Myostatin-induced myotubular atrophy and degradation of sarcomeric proteins is abrogated in Atrogin-1 knockout primary myotubes. A, Immunoblotting (IB) analysis of Myh isoforms (fast and slow), Myl, Atrogin-1, and MuRF1 in Atrogin-1−/− and Atrogin-1+/+ myotubes treated with (+) or without (−) myostatin (Mstn). The levels of α-tubulin were assessed to ensure equal loading. B, Quantification of average myotube area (μm2) in wild-type (Atrogin-1+/+) and Atrogin-1-null mice (Atrogin−/−) after treatment with myostatin. Graph represents the average myotube area (μm2) analyzed per genotype, across 20 images from two coverslips from two independent experiments. P < 0.001(***) and error bars represent mean ± sd. Ctrl, Control.
Fig. 5.
Fig. 5.
Myosin heavy and light chain proteins are physically associated with Atrogin-1 and are ubiquitinated by Atrogin-1 in vitro. A and B, Coimmunoprecipitation (Co-IP) analysis of CTAP-labeled Atrogin-1 (Atrogin-1-CTAP) in the presence (+) or absence (−) of recombinant myostatin protein. Myh and Myl were detected using the antibodies against Myh (all isoforms) and Myl (all isoforms). C, To study in vitro ubiquitination, Myh (1 μm) was incubated with increasing concentrations (0 nm, 20 nm, 30 nm, and 50 nm) of GST-hAtrogin-1 for 1 h. Immunoblotting (IB) analysis with an anti-ubiquitin (Ubi) antibody is shown. Ubiquitinated Myh band is indicated within the brackets.
Fig. 6.
Fig. 6.
Myostatin induces skeletal muscle atrophy by up-regulating FoxO1 and Atrogin-1 (but not MuRF1) through a Smad3-dependent signaling mechanism. A, Immunoblotting (IB) analysis of Smad3 and pSmad3 after treatment with (+) or without (−) myostatin in C2C12 myotubes. The levels of α-tubulin were assessed to ensure equal loading. B, real-time qPCR analysis was used to detect the truncated allele (Exon8) of Smad3 in Smad3−/− and Smad3+/+ primary myoblasts. The expression of Gapdh was assessed to ensure that equal amount of template was used in PCR. C, IB analysis of Myh (all isoforms), Myl (all isoforms), FoxO1, p-FoxO1, MuRF1, and Atrogin-1 in primary myotube cultures from Smad3-null (Smad3−/−) and wild-type (Smad3+/+) mice, after treatment with (+) or without (−) recombinant myostatin protein (Mstn). The levels of α-tubulin were assessed to ensure equal loading. D, The real time-qPCR analysis of Atrogin-1, FoxO1, MuRF1, and Smad3 expression after shRNA-mediated Smad3 knockdown (shSmad3) and myostatin (Mstn) treatment. Graph represents mean relative fold changes and is indicative of three replicate experiments. Each mRNA expression level was determined relative to the mean expression level of that mRNA in shCon cells. P < 0.001 (***) and the error bars represent ± sd. E, IB analysis of Smad3, Atrogin-1, FoxO1, and MuRF1 proteins in Smad3 knockdown (shSmad3) C2C12 myotubes treated with or without myostatin. The levels of α-tubulin were assessed to ensure equal loading of protein.
Fig. 7.
Fig. 7.
Mechanism of myostatin-induced skeletal muscle atrophy. Proposed mechanism behind myostatin-induced skeletal muscle wasting. Myostatin up-regulates components of ubiquitin proteolysis system, including Atrogin-1, through a FoxO1- and Smad3-dependent signaling mechanism. Enhanced activation of the ubiquitination system leads to degradation of the majority of sarcomeric proteins, which are required for normal muscle growth and development. Myostatin also inhibits protein synthesis by decreasing the phosphorylation of Akt and reduced protein synthesis machinery, leading to enhanced progression of skeletal muscle atrophy. Importantly, myostatin-induced skeletal muscle atrophy is reversible, as shown through the action of its known antagonists, including soluble ActRIIB and follistatin (Fstn). Arrows (→) represent activation, whereas blunt-ended (⊥) lines represent inhibition.

References

    1. Tisdale MJ. 2009. Mechanisms of cancer cachexia. Physiol Rev 89:381–410 - PubMed
    1. Evans WJ. 2010. Skeletal muscle loss: cachexia, sarcopenia, and inactivity. Am J Clin Nutr 91:1123S–1127S - PubMed
    1. Csibi A , Leibovitch MP , Cornille K , Tintignac LA , Leibovitch SA. 2009. MAFbx/Atrogin-1 controls the activity of the initiation factor eIF3-f in skeletal muscle atrophy by targeting multiple C-terminal lysines. J Biol Chem 284:4413–4421 - PubMed
    1. Csibi A , Tintignac LA , Leibovitch MP , Leibovitch SA. 2008. eIF3-f function in skeletal muscles: to stand at the crossroads of atrophy and hypertrophy. Cell Cycle 7:1698–1701 - PubMed
    1. Bodine SC , Latres E , Baumhueter S , Lai VK , Nunez L , Clarke BA , Poueymirou WT , Panaro FJ , Na E , Dharmarajan K , Pan ZQ , Valenzuela DM , DeChiara TM , Stitt TN , Yancopoulos GD , Glass DJ. 2001. Identification of ubiquitin ligases required for skeletal muscle atrophy. Science 294:1704–1708 - PubMed

Publication types

MeSH terms