. 2011 Nov;121(11):4257-67.
doi: 10.1172/JCI58509. Epub 2011 Oct 3.

SCRIB expression is deregulated in human prostate cancer, and its deficiency in mice promotes prostate neoplasia

Affiliations

SCRIB expression is deregulated in human prostate cancer, and its deficiency in mice promotes prostate neoplasia

Helen B Pearson et al. J Clin Invest. 2011 Nov.

Abstract

Loss of cellular polarity is a hallmark of epithelial cancers, raising the possibility that regulators of polarity have a role in suppressing tumorigenesis. The Scribble complex is one of at least three interacting protein complexes that have a critical role in establishing and maintaining epithelial polarity. In human colorectal, breast, and endometrial cancers, expression of the Scribble complex member SCRIB is often mislocalized and deregulated. Here, we report that Scrib is indispensable for prostate homeostasis in mice. Scrib heterozygosity initiated prostate hyperplasia, while targeted biallelic Scrib loss predisposed mice to prostate intraepithelial neoplasia. Mechanistically, Scrib was shown to negatively regulate the MAPK cascade to suppress tumorigenesis. Further analysis revealed that prostate-specific loss of Scrib in mice combined with expression of an oncogenic Kras mutation promoted the progression of prostate cancer that recapitulated the human disease. The clinical significance of the work in mice was highlighted by our observation that SCRIB deregulation strongly correlated with poor survival in human prostate cancer. These data suggest that the polarity network could provide a new avenue for therapeutic intervention.


Figures

Figure 1
Figure 1. Generation and analysis of Scrib-deficient mice.
(A) Schematic representation of the WT Scrib allele, targeting construct, and mutated Scrib allele. Excision of the Frt-flanked PGK-Neo cassette in the LoxP-flanked targeting vector was accomplished by crossing Scribfl-Neo mice to Actin-FLPe mice, producing the Scrib floxed (Scribfl) allele. The insertion of EcoRV and KpnI restriction sites permitted screening for recombinant ES cell clones (see Supplemental Figure 1, A and B). Scrib-KO mice were derived by crossing Scrib+/fl mice with a germline Cre-deleter mouse. Exons are indicated as boxes and LoxP/FLPe sites as triangles. (B) Photographs of WT, Scrib+/–, and KO E14.5 embryos. Scale bar: 10 mm. (C) Western blot analysis of embryonic brain lysates (E16.5) confirmed Scrib loss in Scrib+/– and KO compared with WT embryos.
Figure 2
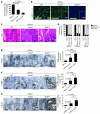
Figure 2. Scrib heterozygosity predisposes to prostate hyperplasia.
(A) PCR analysis of genomic DNA to detect WT (290 bp) and KO (550 bp) Scrib alleles in Scrib+/– and WT prostate. (B) qRT-PCR for Scrib mRNA confirmed a significant, 55% reduction in Scrib+/– compared with WT prostates (P = 0.0065, unpaired t test). Error bars indicate SD. (C) Scrib IF staining of WT and Scrib+/– hyperplastic prostate. (D) Representative H&E images of normal WT and hyperplastic Scrib+/– prostate (400 days). (E) Phenotype incidence in WT and Scrib+/– mice at 100, 200, and 400 days (n ≥ 10). Scale bars: 50 μm (larger panels) and 10 μm (insets).
Figure 3
Figure 3. Elevated Ras/MAPK signaling is required for Scrib-deficient prostate hyperplasia.
(A) PCNA IHC shows a significant increase in PCNA-positive cells in Scrib+/– lesions (2.26% ± 0.62%, mean ± SD) compared with WT (0.47% ± 0.09%, P < 0.0001, unpaired t test, 400 days). (B) IHC in Scrib+/– hyperplastic foci revealed aberrant E-cadherin and p-ERM compared with WT tissue. Arrows indicate aberrant expression. Right column: IF to detect Par3 (red) and pan-Dlg (green) shows that these polarity regulators are mislocalized in Scrib+/– prostate hyperplasia compared with WT prostate (400 days). N, normal Scrib+/– tissue; Hyp, hyperplastic Scrib+/– tissue. Arrowheads indicate Par3 accumulation at tight junctions. (C) IHC revealed a significant elevation in p-ERK–positive nuclei in Scrib+/– lesions compared with WT (unpaired t test, 400 days). (D) IHC revealed a significant elevation in p-ELK1–positive nuclei in Scrib+/– lesions compared with WT (unpaired t test, 400 days). (E) Representative H&E images of Scrib+/– prostates administered vehicle or PD0325901 (20 mg/kg, 5 days on, 2 days off for 3 weeks at 230–260 days of age), and p-ERK staining showing efficient MEK inhibition. (F) Scrib+/– prostate weight is significantly decreased upon MEK inhibition (0.30 ± 0.04 g, mean ± SD) compared with administration of vehicle (0.45 g ± 0.08, P = 0.0003, Mann-Whitney U non-parametric test), similar to the level in WT prostate (P = 0.4606, Mann-Whitney U non-parametric t test). Scale bar: 50 μm (larger panels) and 10 μm (insets). Error bars indicate SD.
Figure 4
Figure 4. Biallelic Scrib loss causes prostate neoplasia.
(A) Scrib mRNA is decreased in PBCre+;Scrib+/fl (45.2%) and PBCre+;Scribfl/fl (14.5%) compared with PBCre+ prostates at 400 days. (B) Scrib IF shows reduced Scrib expression in PBCre+;Scribfl/fl prostate epithelium (400 days). (C) Representative H&E images of PBCre+, PBCre+;Scrib+/fl, and PBCre+;Scribfl/fl prostates (400 days). (D) Prostate phenotype incidence at 100, 200, and 400 days (n ≥ 10). (E) PCNA IHC shows a significant increase in the number of PCNA-positive cells in PBCre+;Scribfl/fl mice (4.0% ± 0.24%) compared with PBCre+;Scrib+/fl (2.1% ± 0.82%) and PBCre+ mice (0.6% ± 0.38%) at 400 days. (F) p-ERK staining revealed a significant increase in MAPK signaling in PBCre+;Scrib+/fl (7.1% ± 1.64%) and PBCre+;Scribfl/fl mice (13.1% ± 4.18%) compared with PBCre+ controls (1.8% ± 0.58%) at 400 days. (G) p-ELK1 staining shows a significant increase in p-ELK1 expression in PBCre+;Scrib+/fl (1.8% ± 0.25%) and PBCre+;Scribfl/fl (4.2% ± 1.67%) compared with WT tissue (0.4% ± 0.13%) at 400 days. Arrows indicate positive nuclei. Scale bars: 50 μm (larger panels) and 10 μm (insets). Data are mean ± SD; n = 3; P values represent unpaired t test. Error bars indicate SD.
Figure 5
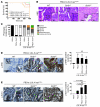
Figure 5. Scrib loss and K-ras hyperactivation cooperate to facilitate prostate tumor progression.
(A) Kaplan-Meier survival plot shows a significant reduction in PBCre+;Scribfl/fl;LSL-K-rasG12D/+ average survival (372 days) compared with PBCre+;LSL-K-rasG12D/+ mice (χ2 = 4.20, P = 0.0449, log-rank test, n ≥ 10). (B) Representative H&E images of PBCre+;LSL-K-rasG12D/+, PBCre+;Scrib+/fl;LSL-K-rasG12D/+, and PBCre+;Scribfl/fl;LSL-K-rasG12D/+ prostates (400 days). (C) Prostate phenotype incidence (400 days, n ≥ 10). (D) IHC to detect p-ERK reveals that the number of p-ERK–positive nuclei in PBCre+;LSL-K-rasG12D/+ (21% ± 11.24%), PBCre+;Scrib+/fl;LSL-K-rasG12D/+ (20% ± 11.41%), and PBCre+;Scribfl/fl;LSL-K-rasG12D/+ (17% ± 6.35%) prostate tumors was significantly elevated compared with control prostate (*P ≤ 0.0496), yet no statistical difference was determined between the double mutants and K-ras activation alone (P > 0.6168) at 400 days. (E) IHC to detect p-ELK1 revealed a significant increase in p-ELK1 expression in PBCre+;Scrib+/fl;LSL-K-rasG12D/+ (36.6% ± 6.54%), and PBCre+;Scribfl/fl;LSL-K-rasG12D/+ (50.5% ± 0.43%) prostate lesions compared with PBCre+;LSL-K-rasG12D/+ (17.7% ± 0.55%, P ≤ 0.0448) and PBCre+ (0.4% ±0.07, P ≤ 0.0052) prostate epithelium at 400 days. Scale bars: 50 μm (larger panels) and 10 μm (insets). In D and E, data are mean ± SD; n = 3; P values represent unpaired t test. Error bars indicate SD.
Figure 6
Figure 6. Human prostate tissue microarray.
Representative images of TMA samples stained by IHC to detect SCRIB indicating the scoring strategy employed to grade SCRIB intensity (0 negative, +1 weak, +2 moderate, and +3 strong) (A) and mislocalization (B). Scale bars: 50 μm (larger panels) and 10 μm (insets). Samples displaying uniform basolateral membrane expression were designated as normal. Mislocalized expression was classified as clustered accumulation of SCRIB (group A: at cell-cell junctions; group B: along the membrane circumference; group A/B displays features of groups A and B). Scale bars: 50 μm (larger panels) and 10 μm (insets). (C) Kaplan-Meier plot indicates no significant difference between overall SCRIB intensity and PSA recurrence–free survival (P = 0.0687, log-rank test). Moreover, negative samples showed no significant difference in PSA recurrence–free survival compared with positive samples (P > 0.2196, log-rank test). (D) Kaplan-Meier plot comparing normal and mislocalized SCRIB expression revealed a significant reduction in PSA recurrence–free survival for all modes of mislocalization (P = 0.0001, log-rank test).

Comment in

References

    1. Nelson WJ. Adaptation of core mechanisms to generate cell polarity. Nature. 2003;422(6933):766–774. doi: 10.1038/nature01602. - DOI - PMC - PubMed
    1. Dow LE, Humbert PO. Polarity regulators and the control of epithelial architecture, cell migration, and tumorigenesis. Int Rev Cytol. 2007;262:253–302. doi: 10.1016/S0074-7696(07)62006-3. - DOI - PubMed
    1. Wodarz A, Nathke I. Cell polarity in development and cancer. Nat Cell Biol. 2007;9(9):1016–1024. doi: 10.1038/ncb433. - DOI - PubMed
    1. Huang L, Muthuswamy SK. Polarity protein alterations in carcinoma: a focus on emerging roles for polarity regulators. Curr Opin Genet Dev. 2010;20(1):41–50. - PMC - PubMed
    1. Humbert PO, Grzeschik NA, Brumby AM, Galea R, Elsum I, Richardson HE. Control of tumourigenesis by the Scribble/Dlg/Lgl polarity module. Oncogene. 2008;27(55):6888–6907. doi: 10.1038/onc.2008.341. - DOI - PubMed

Publication types

MeSH terms