. 2011 Nov;55(9):1016-36.
doi: 10.1093/annhyg/mer073. Epub 2011 Sep 28.

Exposure and emissions monitoring during carbon nanofiber production--Part I: elemental carbon and iron-soot aerosols

Affiliations

Exposure and emissions monitoring during carbon nanofiber production--Part I: elemental carbon and iron-soot aerosols

M Eileen Birch et al. Ann Occup Hyg. 2011 Nov.

Abstract

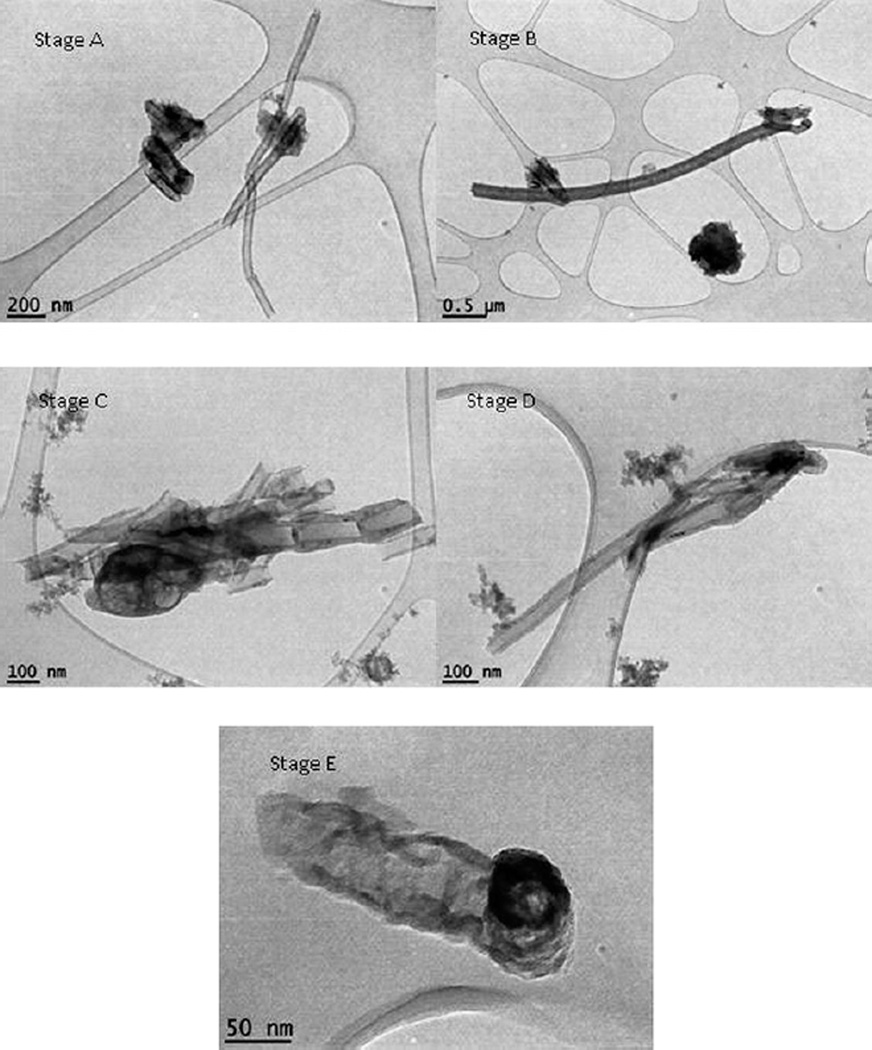
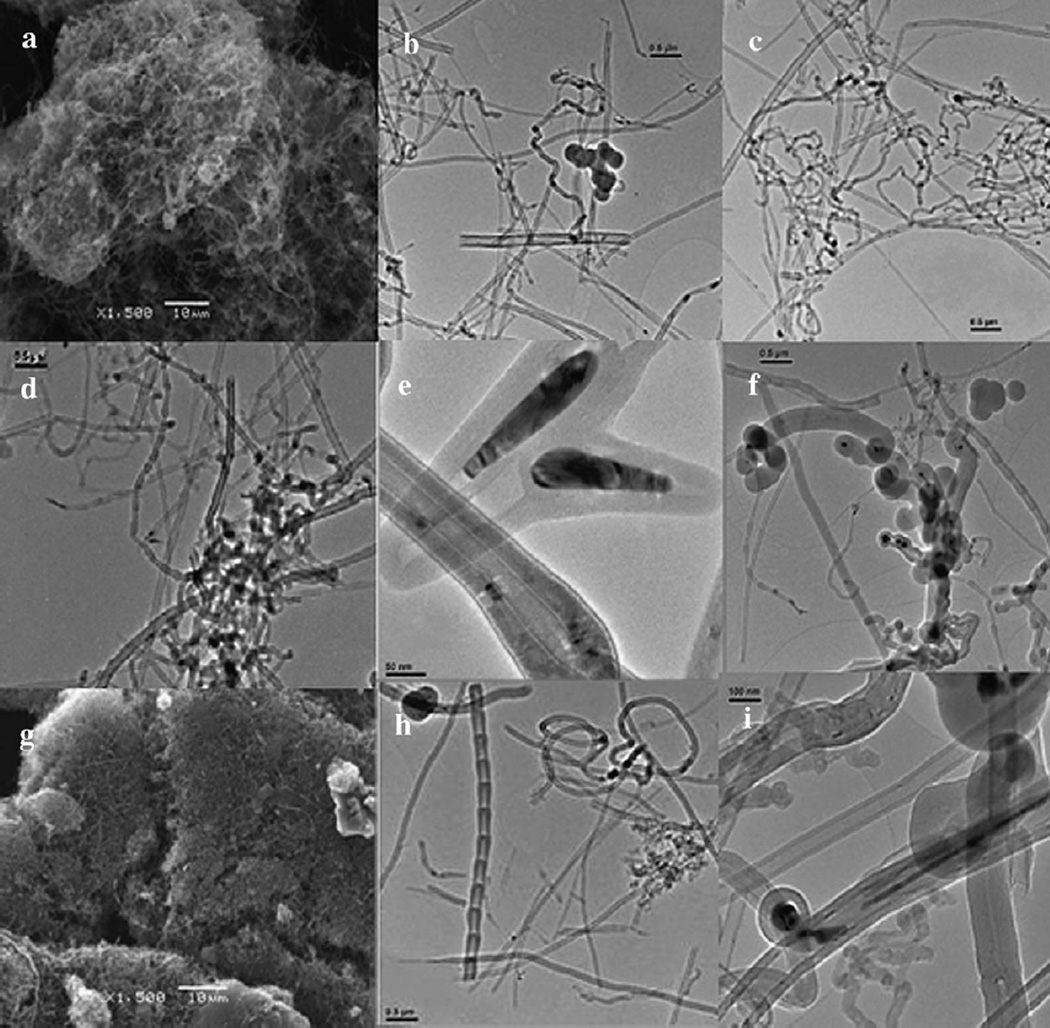
Production of carbon nanofibers and nanotubes (CNFs/CNTs) and their composite products is increasing globally. High volume production may increase the exposure risks for workers who handle these materials. Though health effects data for CNFs/CNTs are limited, some studies raise serious health concerns. Given the uncertainty about their potential hazards, there is an immediate need for toxicity data and field studies to assess exposure to CNFs/CNTs. An extensive study was conducted at a facility that manufactures and processes CNFs. Filter, sorbent, cascade impactor, bulk, and microscopy samples, combined with direct-reading instruments, provided complementary information on air contaminants. Samples were analyzed for organic carbon (OC) and elemental carbon (EC), metals, and polycyclic aromatic hydrocarbons (PAHs), with EC as a measure of CNFs. Transmission electron microscopy with energy-dispersive X-ray spectroscopy also was applied. Fine/ultrafine iron-rich soot, PAHs, and carbon monoxide were production byproducts. Direct-reading instrument results were reported previously [Evans DE et al. (Aerosol monitoring during carbon nanofiber production: mobile direct-reading sampling. Ann Occup Hyg 2010;54:514-31.)] Results for time-integrated samples are reported as companion papers in this Issue. OC and EC, metals, and microscopy results are reported here, in Part I, while results for PAHs are reported in Part II [Birch ME. (Exposure and Emissions Monitoring during Carbon Nanofiber Production-Part II: Polycyclic Aromatic Hydrocarbons. Ann. Occup. Hyg 2011; 55: 1037-47.)]. Respirable EC area concentrations inside the facility were about 6-68 times higher than outdoors, while personal breathing zone samples were up to 170 times higher.


Figures

Fig. 1
Fig. 1
Transmission electron microscopy images of particles size selected by impactors located in a thermal treatment processing area. Cut points are 2.5–10 µm (Stage A), 1.0–2.5 µm (Stage B), 0.5–1.0 µm (Stage C), 0.25–0.5 (Stage D), and <0.25 µm (Stage E after filter). Lacey carbon-coated Ni and SiO-coated Ni grids were used in impactors.
Fig. 2
Fig. 2
(a) Transmission electron microscopy images of particles size selected by impactors located in the reactor area. Cut points are 2.5–10 µm (Stage A), 1.0–2.5 µm (Stage B), 0.5–1.0 µm (Stage C), 0.25–0.5 (Stage D), and <0.25 µm (Stage E after filter). Lacey carbon-coated Ni and SiO-coated Ni grids were used in impactors. (b) Energy-dispersive X-ray spectroscopy of portion of particle collected on Stage E (after filter) of impactor located in reactor area. SiO-coated Ni grid used. All particles on Stage E (<0.25 µm) were iron-rich (40–55% by weight).
Fig. 3
Fig. 3
MOUDI impactor substrates showing carbon nanofibers mainly on upper stages and iron aerosol on lower ones. Top row (left to right) shows Stages 0 (inlet), 2, 4, and 6. Bottom row (left to right) shows Stages 7 through 10.
Fig. 4
Fig. 4
Energy-dispersive X-ray spectroscopy of portion of particle sampled by electrostatic precipitator located in reactor area. SiO-coated Ni grid used. Area analyzed was ~30% iron by weight.
Fig. 5
Fig. 5
Transmission electron microscopy images of particles size selected by impactors located in a bagging area. Cut points are 2.5–10 µm (Stage A), 1.0–2.5 µm (Stage B), 0.5–1.0 µm (Stage C), 0.25–0.5 (Stage D), and <0.25 µm (Stage E after filter). Lacey carbon-coated Ni and SiO-coated Ni grids were used in impactors.
Fig. 6
Fig. 6
Transmission electron microscopy images of polydisperse particles sampled by an electrostatic precipitator operated in the dryer area. SiO-coated Ni grid was used for sampling.
Fig. 7
Fig. 7
Transmission electron microscopy (b–f, h, i) and scanning electron microscopy (a, g) images of bulk carbon nanofiber materials. Images (a–f) are unprocessed materials. Images (g–i) are processed product. Scale bars are: (a) and (g) = 10 µm; (b–d) and (h) = 500 nm; (e) = 50 nm; (f and i) = 100 nm.
Fig. 8
Fig. 8
(a) Average OC, EC and total carbon (TC) results for total and respirable (resp.) dust samples collected outdoors and in office and plant background areas of the facility on two consecutive days in December. (b) Average OC, EC, and TC results for total and resp. dust samples collected in the thermal treatment area of the facility on two consecutive days in December. (c) Average OC, EC, and TC results for total and resp. dust samples collected in the reactor A area of the facility on two consecutive days in December. (d) Average OC, EC, and TC results for total and resp. dust samples collected in the reactor B area of the facility on two consecutive days in December.
Fig. 9
Fig. 9
(a) OC, EC, and TC results for total and thoracic dust samples collected outdoors and in office and plant background areas of the facility on the first survey day in February. (b) OC, EC, and TC results for total, thoracic, and respirable dust samplers located in the reactor area of the facility on the first survey day in February (RA and RB indicate reactors A and B). (c) OC, EC, and TC results for total and thoracic dust samplers located in the thermal treatment area of the facility on the first survey day in February. (d) OC, EC, and TC results for total, thoracic, and respirable dust samplers located in the control room of the facility on the first survey day in February.
Fig. 10
Fig. 10
(a) OC, EC, and TC results for total, thoracic, and respirable dust samples collected in the reactor A area of the facility on the second survey day in February. (b) OC, EC, TC results for total, thoracic, and respirable dust samples collected in the thermal treatment area of the facility on the second survey day in February. (c) OC, EC, and TC results for total, thoracic, and respirable dust samples collected outdoors and in office and plant background areas of the facility on the second survey day in February.
Fig. 11
Fig. 11
(a) Total and respirable (resp.) iron (Fe) and EC concentrations in different areas of the facility and outdoors. ‘Pers. resp.’ is personal (breathing zone) respirable sample. Respirable plant background on Day 2 (resp. D2) is average for two samplers. Outdoor sample was nondetect. Surveys conducted on two consecutive days (D1 and D2) in December. (b) Total, thoracic (thor), and resp. Fe and EC concentrations in different areas of the facility and outdoors. Breathing zone thoracic sample. Asterisk indicates Fe result based on one filter punch; other Fe results based on two. Total Fe in thermal treatment area is average of one punch from two samplers; outdoor sample was nondetect. Survey conducted during first week of February. (c) Total, thor, and resp. iron Fe and EC concentrations in different areas of the facility and outdoors. Breathing zone thoracic sample. Asterisk indicates Fe result based on one filter punch; other Fe results based on two. Total Fe in thermal treatment area is average of one punch from two samplers; outdoor sample was nondetect. Survey conducted during second week of February.
Fig. 12
Fig. 12
(a) Iron (Fe) and EC results for impactors in the thermal treatment area on the initial survey day. (b) Fe and EC results for impactors in the reactor area on the initial survey day. (c) Fe and EC results for Sioutas and MOUDI impactors located in the thermal treatment area on the initial survey day. Sioutas results are indicated by ‘(S)’ after the particle size bin. MOUDI EC results are reported for Stages 1, 3, and 5 only (see text). Asterisk indicates Fe result based on one filter punch; all other Fe results based on two.

References

    1. Baron PA, Deye GJ, Chen BT, et al. Aerosolization of single-walled carbon nanotubes for an inhalation study. Inhal Toxicol. 2008;8:751–760. - PubMed
    1. BCC Research. Nanotechnology: a realistic market assessment. [Accessed 12 December 2010];2010 report code: NANO31D, Analyst: Andrew McWilliams; July 2010. Available at http://www.bccresearch.com/report/NAN031D.html.
    1. Birch ME. Analysis of carbonaceous aerosols—interlaboratory comparison. Analyst. 1998;123:851–857. - PubMed
    1. Birch ME. Occupational monitoring of particulate diesel exhaust by NIOSH Method 5040. Appl Occup Environ Hyg. 2002;17:400–405. - PubMed
    1. Birch ME. West Conshohocken, PA: ASTM International; 2003. Standard test method for monitoring diesel particulate exhaust in the workplace, published by ASTM as standard test method D 6877—03.

MeSH terms