. 2011 Dec;39(22):e149.
doi: 10.1093/nar/gkr718. Epub 2011 Sep 28.

Transposon Ac/Ds-induced chromosomal rearrangements at the rice OsRLG5 locus

Affiliations

Transposon Ac/Ds-induced chromosomal rearrangements at the rice OsRLG5 locus

Yuan Hu Xuan et al. Nucleic Acids Res. 2011 Dec.

Abstract

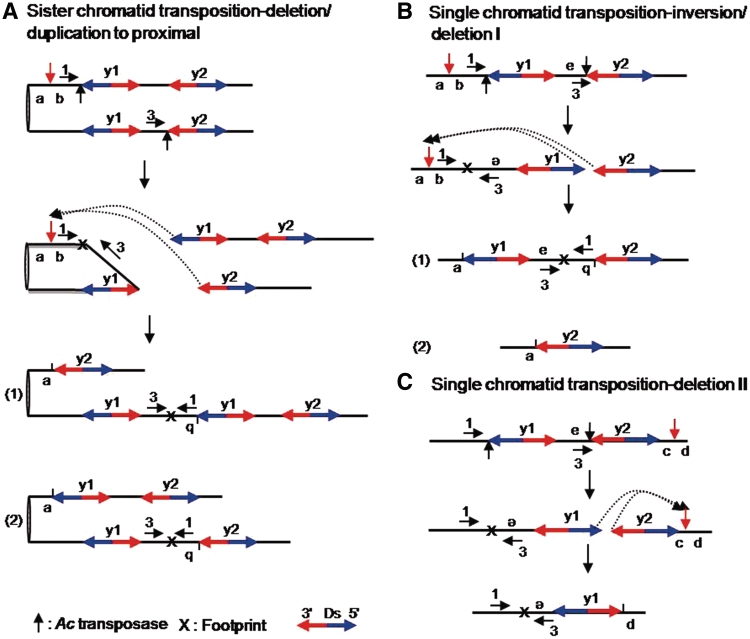
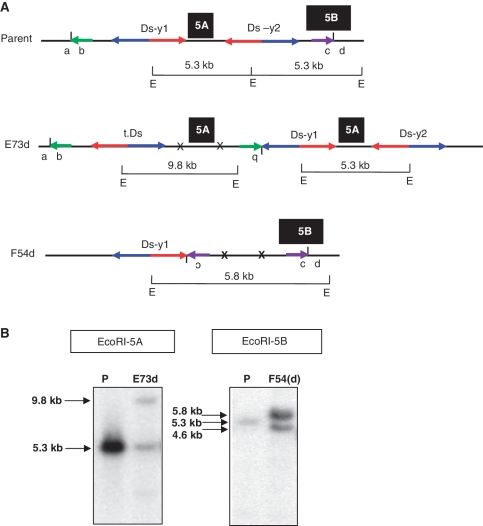
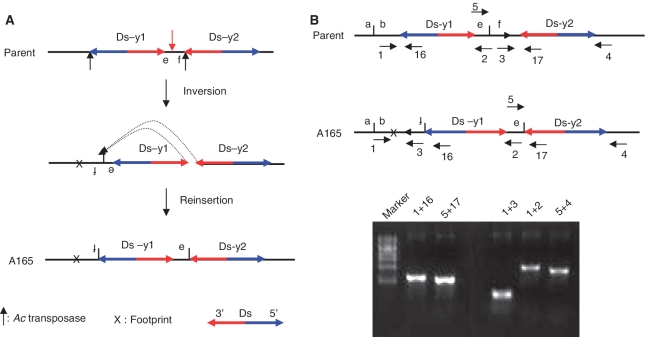
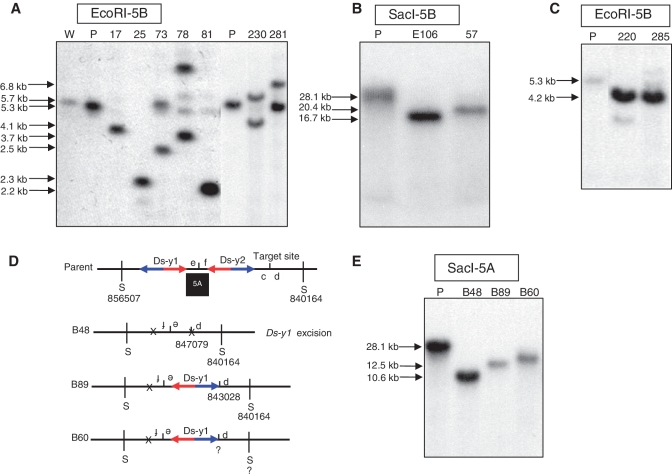
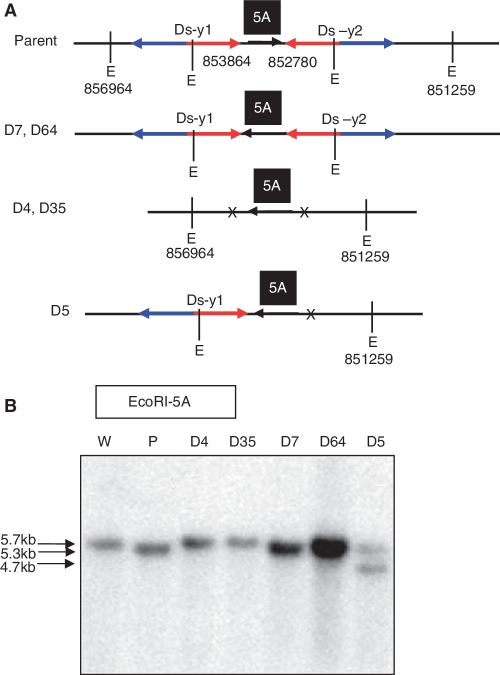
Previous studies have shown that pairs of closely-linked Ac/Ds transposable elements can induce various chromosomal rearrangements in plant genomes. To study chromosomal rearrangements in rice, we isolated a line (OsRLG5-161) that contains two inversely-oriented Ds insertions in OsRLG5 (Oryza sativa Receptor like kinase Gene 5). Among approximately 300 plants regenerated from OsRLG5-161 heterozygous seeds, 107 contained rearrangements including deletions, duplications and inversions of various sizes. Most rearrangements were induced by previously identified alternative transposition mechanism. Furthermore, we also detected a new class of rearrangements that contain juxtaposed inversions and deletions on the same chromosome. We propose that these novel alleles were generated by a previously unreported type of alternative transposition reactions involving the 5' and 3' termini of two inversely-oriented Ds elements located on the same chromatid. Finally, 11% of rearrangements contained inversions resulting from homologous recombination between the two inverted Ds elements in OsRLG5-161. The high frequency inheritance and great variety of rearrangements obtained suggests that the rice regeneration system results in a burst of transposition activity and a relaxation of the controls which normally limit the transposition competence of individual Ds termini. Together, these results demonstrate a greatly enlarged potential of the Ac/Ds system for plant chromosome engineering.


Figures

Figure 1.
Figure 1.
Structures of the Ac and Ds T-DNA vectors and the OsRLG5::Ds allele. Expression of Ac cDNA is driven by the CaMV 35S promoter in the Ac T-DNA vector. A BAR selection marker and GUS reporter gene were inserted inside the Ds T-DNA vector. The OsRLG5::Ds allele carries a single Ds insertion in the promoter region of the OsRLG5 gene. White and black boxes indicate UTRs and exons of OsRLG5, respectively. Short vertical arrow indicates an EcoRI restriction site inside the GUS coding region. The numbers 5 and 3 above the Ds T-DNA vector or Ds-y1 indicate the 5′ and 3′ Ds-ends, respectively.
Figure 2.
Figure 2.
Selection of plants containing two Ds elements at the OsRLG5 locus. (A) Southern blot hybridization to identify Ds transpositions in plants regenerated from OsRLG5::Ds seeds. EcoRI-digested genomic DNA samples from the indicated lines were hybridized with a 1.8-kb DNA fragment from the GUS coding region. The progenitor OsRLG5::Ds line exhibits a 4.7-kb band, while most regenerated lines contain multiple novel bands. The OsRLG5-161 line (red) lacks the 4.7-kb band. (B) Structure of the OsRLG5::Ds locus. Red oval indicates centromere, black boxes indicate coding sequences of OsRLG5, and white boxes indicate UTRs. Red and blue arrows indicate the 5′ and 3′ Ds termini. Letters E and S indicate EcoRI and SacI restriction sites, respectively. Boxes labeled GUS and 5C indicate fragments used as probes for Southern analysis. The 2.6 and 13.7 kb indicate distances from the Ds-y1 insertion site to upstream and downstream SacI sites, respectively. Asterisk indicates EcoRI site located inside the Ds-y1 element. The 5.9-kb marked segment above the map indicates the size of Ds. (C) Southern blot hybridization to identify lines containing two copies of Ds inserted in the OsRLG5 locus. SacI-digested DNA samples from the indicated lines were hybridized with probe 5C from the OsRLG5 gene. The 16.3-kb band represents the reference OsRLG5 allele lacking Ds. The original OsRLG5::Ds allele produced a 22.2-kb fragment (blue arrow), while the OsRLG5-161 allele has a 28.1-kb SacI fragment (red arrow). (D) The OsRLG5-161 allele carries two Ds elements in inverted orientation and separated by a distance of 1.1 kb. The numbers below the map indicate the locations of Ds-y1 and Ds-y2 insertion sites on chromosome 1. Horizontal lines indicate the sizes of restriction fragments generated by SacI digestion. Other symbols as in 2B.
Figure 3.
Figure 3.
Genomic structure of OsRLG5-161 and adjacent genes. The OsRLG5-161 allele is flanked on the proximal side by OsRLG20 and the distal side by OsRLG18 (each OsRLG gene consists of two exons). Numbered arrows indicate the orientations and positions of PCR primers. Black boxes marked 5A and 5B indicate fragments used as probes for Southern analysis. Horizontal lines below the map indicate EcoRI or SacI restriction fragments which hybridize with the indicated probes; red asterisks indicate EcoRI sites located inside the Ds-y1 and Ds-y2 elements. Other symbols as in Figure 2.
Figure 4.
Figure 4.
Models for SCT with a proximal target site and SLCT. (A) SCT is depicted in two steps. In all the diagrams, sister chromatids are attached at the centromere (left). Element y1 and y2 indicate Ds-y1 and Ds-y2, respectively. Transposases cut the 5′-end of y1 on the upper chromatid and the 3′-end of y2 on the lower chromatid, as indicated by the black vertical arrows in the top diagram. The two ends are then reinserted into a new target site between a and b, as shown by the dotted arrows in the second diagram. A red vertical arrow indicates the new target site. Part (1) of the third diagram shows that insertion of the 3′-end of y2 next to a and the 5′-end of y1 next to b generates one chromatid (upper) containing a flanking proximal deletion and a single copy of Ds, and a second chromatid (lower) containing an inverted duplication and three copies of Ds. Part (2) of the fourth diagram shows that insertion of the 5′-end of y1 next to a and the 3′-end of y2 next to b generates one chromatid (upper) containing a flanking proximal deletion and two copies of Ds, and a second chromatid (lower) containing an inverted duplication and two copies of Ds. Note both outcomes result in inversion of sequences flanking Ds. Blue and red arrows indicate the 5′ and 3′ directions of Ds elements, respectively. X indicates a footprint. Primers used to detect rearrangements were shown as horizontal arrows with numbers. (B) The inversion/deletion I process derived from SLCT is depicted in three steps. Transposases cut the 5′-end of y1 and the 3′-end of y2, as indicated by the black vertical arrows in the top diagram. The 5′ and 3′ termini of y1 and y2, respectively, are re-inserted into the proximal region with respect to the original Ds sites, as shown by the dotted arrows and red vertical arrow in the second diagram. Consequently, the fragment from the reinsertion site on the 5′-end of y1 was inverted and was jointed to the 3′-end of y2. Reinsertion of the 5′ and 3′ termini of y1 and y2, respectively, at the target site between a and b leads to two configurations, as shown in parts (1) and (2) in the diagram. Part (1) shows inversions of fragment carrying b located between e and the 3′-end of y2. Part (2) indicates deletions, referred to as deletion I, including fragments carrying b and e, and y1. (C) Deletion II derived from a SLCT is shown in two steps. Transposases cut the 5′-end of y1 and the 3′-end of y2, as indicated by black vertical arrows in the top diagram. The 5′ and 3′ termini of y1 and y2, respectively, are re-inserted into the distal region with respect to the original Ds sites, as shown by the dotted arrows and red vertical arrowhead in the second diagram. Consequently, the 5′-end of y1 reinserted next to d causes inversion of fragments containing e and y1 and deletion of fragment containing c and y2, which is called deletion II.
Figure 5.
Figure 5.
Genomic structure and Southern blot hybridization of SCT-induced duplications. (A) Genomic structures of parent and SCT-induced duplications (E73d and F54d) are shown. Short vertical lines between a and b and between c and d indicate new junctions of E73d and F54d, respectively. X indicates Ds excision footprints and t.Ds means translocated Ds element. Green and purple short horizontal arrows indicate the orientations of the duplicated regions. Inversion of duplicated regions (b of E73d and c of F54d) is depicted as upside-down characters. Black boxes 5A and 5B indicate probe locations as described in Figure 3. The sizes of EcoRI fragments that span the probes are shown above horizontal bars marked with E, which stands for the EcoRI recognition site. The 5′ and 3′-ends of both Ds elements are indicated by blue and red arrows, respectively. (B) Duplication line E73d contains two bands: one band of 5.3 kb (same as parental, P), and a second band measuring 9.8 kb. These bands correspond to the fragments shown in (A). Line F54d contains a 5.8-kb band produced from the duplication chromosome whose structure is shown in Figure 5A, and a 4.6-kb band derived from a chromosome deletion. The parental (P) line produces a band of 5.3 kb. Breakpoints of the deletion (F54) and duplication F54d are shown in Table 2.
Figure 6.
Figure 6.
Inversion in line A165 induced by SLCT. (A) SLCT model for formation of A165 is depicted in two steps. The parent chromosome is cut by Ac transposase at the 5′-end of Ds-y1 and at the 3′-end of Ds-y2, as shown by the short black arrows in the top diagram. Subsequently, the sequences flanking the 5′ and 3′ Ds termini are ligated, which results in the formation of a footprint (X) and inversion of a segment including Ds-y1 and fragments containing e and f, as shown in the second diagram. The third diagram shows that the excised Ds termini are reinserted into a site between e and f, as shown by the red vertical arrow and dotted arrows in the second diagram. Consequently, inverted fragments containing f and e are joined to the 5′-end of Ds-y1 and to the 3′-end of Ds-y2, respectively. (B) Genomic structures of OsRLG5 locus in parent and A165 lines. Short horizontal arrows (numbered) indicate the orientations and approximate positions of the primers at the OsRLG5 locus. Short vertical line between two Ds elements indicates the e-f target site. The orientation of ITS in the parent is indicated by the arrow. Gel photo shows the products of five PCR reactions using genomic A165 DNA template and the primer pairs indicated above each lane.
Figure 7.
Figure 7.
Transposition-induced deletions in the OsRLG5 locus. (A) Southern blot analysis of lines E106 and 57. Genomic DNA was cut with SacI and hybridized with genomic probe 5B (Figure 3). Chromosomal rearrangement in line E106 was induced by Ds-y1 reinsertion in the proximal region. Ds-y2 was not excised from these two lines. Shorter DNA fragments are detected in these two lines compared with the parental line. (B) Southern blot analysis of deletions in the proximal region. Genomic DNA from the indicated lines was cut with EcoRI and hybridized with probe 5B. Sizes of hybridizing bands are shown at the left of the Southern blot. (C) Southern blot analysis of lines 220 and 285 which contain distal deletions. Genomic DNA was cut with EcoRI and hybridized with probe 5B. Deletion lines produce 4.2-kb fragments which are <5.3-kb band in parental lane. (D) Inferred structures of parental chromosome and distal deletions. Short vertical line between c and d indicates insertion target site. S indicates SacI digestion sites, whose positions are indicated. Ds-y1 was retained in line B89, but excised in line B48. The breakpoint of line B60 was not obtained. (E) SLCT-induced deletions distal to the original Ds position were examined by Southern blot. SacI cut genomic DNA was hybridized with probe 5A (Figure 3). Deletion chromosomes produced shorter bands than the parental line. W, wild-type; P, parental line.
Figure 8.
Figure 8.
Inversions induced by HR between Ds elements. (A) Genomic structures of parent and inversion lines are shown. Numbers indicate positions of Ds-y1, Ds-y2 and EcoRI sites in chromosome 1. Other symbols as in Figure 3. (B) Southern blot analysis of putative HR-induced inversion lines. Genomic DNA from the indicated lines was digested with EcoRI and hybridized with probe 5A. Lines D4 and D35 showed bands of the same size as the wild type allele (5.7 kb), consistent with excision of both Ds-y1 and Ds-y2. Lines D7 and D64 showed bands of the same size (5.3 kb) as parental line (OsRLG5-161), consistent with retention of both Ds-y1 and Ds-y2. Line D5 contained one parental band (5.3 kb) and one shorter band (4.7 kb), suggesting heterozygosity for a parental allele (both Ds elements retained) and the D5 allele in which Ds-y2 had excised. W, wild-type; P, parental line.

Similar articles

Cited by

References

    1. Weil CF, Wessler SR. Molecular evidence that chromosome breakage by Ds element is caused by aberrant transposition. Plant Cell. 1993;5:515–522. - PMC - PubMed
    1. Dooner HK, Belachew A. Chromosome breakage by pairs of closely linked transposable elements of the Ac-Ds family in maize. Genetics. 1991;129:855–862. - PMC - PubMed
    1. Ralston EJ, English J, Dooner HK. Chromosome-breaking structure in maize involving a fractured Ac element. Proc. Natl Acad. Sci. USA. 1989;86:9451–9455. - PMC - PubMed
    1. Zhang J, Peterson T. Genome rearrangements by nonlinear transposons in maize. Genetics. 1999;153:1403–1410. - PMC - PubMed
    1. Zhang J, Peterson T. A segmental deletion series generated by sister-chromatid transposition of Ac transposable elements in maize. Genetics. 2005;171:333–344. - PMC - PubMed

Publication types

Substances