. 2011 Sep;7(9):e1002260.
doi: 10.1371/journal.pgen.1002260. Epub 2011 Sep 22.

Large-scale gene-centric analysis identifies novel variants for coronary artery disease

Collaborators

Large-scale gene-centric analysis identifies novel variants for coronary artery disease

IBC 50K CAD Consortium. PLoS Genet. 2011 Sep.

Erratum in

  • PLoS Genet. 2-12 Aug;8(8). doi: 10.1371/annotation/120649cf-8c28-43c9-a688-c7cd65eb1aec. Roosendaal, Frits R [corrected to Rosendaal, Frits R]

Abstract

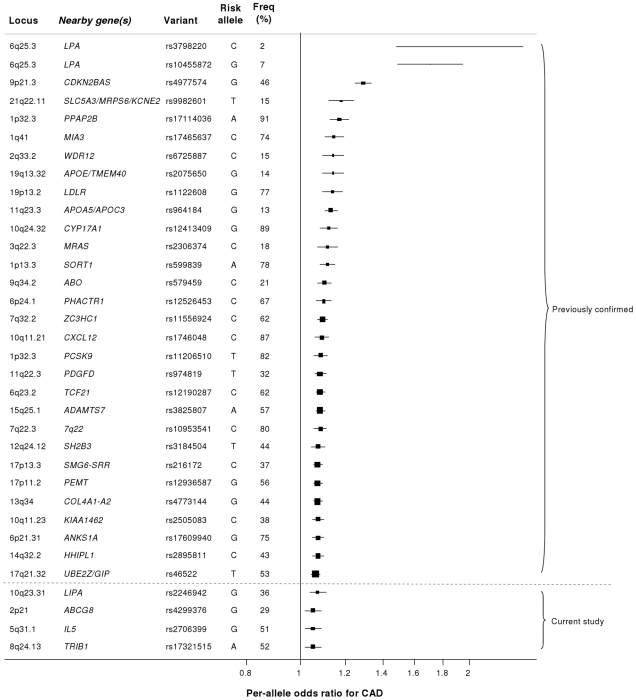
Coronary artery disease (CAD) has a significant genetic contribution that is incompletely characterized. To complement genome-wide association (GWA) studies, we conducted a large and systematic candidate gene study of CAD susceptibility, including analysis of many uncommon and functional variants. We examined 49,094 genetic variants in ∼2,100 genes of cardiovascular relevance, using a customised gene array in 15,596 CAD cases and 34,992 controls (11,202 cases and 30,733 controls of European descent; 4,394 cases and 4,259 controls of South Asian origin). We attempted to replicate putative novel associations in an additional 17,121 CAD cases and 40,473 controls. Potential mechanisms through which the novel variants could affect CAD risk were explored through association tests with vascular risk factors and gene expression. We confirmed associations of several previously known CAD susceptibility loci (eg, 9p21.3:p<10(-33); LPA:p<10(-19); 1p13.3:p<10(-17)) as well as three recently discovered loci (COL4A1/COL4A2, ZC3HC1, CYP17A1:p<5×10(-7)). However, we found essentially null results for most previously suggested CAD candidate genes. In our replication study of 24 promising common variants, we identified novel associations of variants in or near LIPA, IL5, TRIB1, and ABCG5/ABCG8, with per-allele odds ratios for CAD risk with each of the novel variants ranging from 1.06-1.09. Associations with variants at LIPA, TRIB1, and ABCG5/ABCG8 were supported by gene expression data or effects on lipid levels. Apart from the previously reported variants in LPA, none of the other ∼4,500 low frequency and functional variants showed a strong effect. Associations in South Asians did not differ appreciably from those in Europeans, except for 9p21.3 (per-allele odds ratio: 1.14 versus 1.27 respectively; P for heterogeneity = 0.003). This large-scale gene-centric analysis has identified several novel genes for CAD that relate to diverse biochemical and cellular functions and clarified the literature with regard to many previously suggested genes.


Conflict of interest statement

Muredach P Reilly and Daniel J Rader have a research grant from GlaxoSmithKline. The division of Pharmacoepidemiology and Clinical Pharmacology employing Bas Peters, Olaf Klungel, Anthonius de Boer, and Anke-Hilse Maitland-van der Zee has received unrestricted funding for pharmacoepidemiological research from GlaxoSmithKline, Novo Nordisk, the private-public funded Top Institute Pharma (www.tipharma.nl, includes co-funding from universities, government, and industry), the Dutch Medicines Evaluation Board, and the Dutch Ministry of Health. Arthur AM Wilde is a consultant for Transgenomics (Familion test) and Sorin. No other disclosures were reported.

Figures

Figure 1
Figure 1. Design of the study.
Figure 2
Figure 2. Manhattan plots for discovery stage meta-analyses.
Y-axis shows unadjusted −log10(P values) from fixed-effect meta-analysis of discovery stage studies. NB: European and Combined plots are truncated at P = 10−20. Blue horizontal line at P = 10−4 indicates threshold for replication; Red horizontal line at P = 3×10⁻⁶ indicates array-wide significance level.
Figure 3
Figure 3. Novel loci identified in the current study.
Loci ordered by chromosomal position. SNP = SNP showing strongest evidence of association in discovery stage studies; Frequency = pooled frequency of risk allele across controls; European discovery = per-allele odds ratio, confidence interval and 2-tailed P value from fixed-effect meta-analysis of European discovery stage studies; South Asian discovery = per-allele odds ratio, confidence interval and 2-tailed P value from fixed-effect meta-analysis of South Asian discovery stage studies; Combined discovery = per-allele odds ratio, confidence interval and 2-tailed P value from fixed-effect meta-analysis of all European and South Asian discovery stage studies combined; Replication = per-allele odds ratio, confidence interval and 1-tailed P value from fixed-effect meta-analysis of replication stage studies comprising non-overlapping participants from CARDIoGRAM plus all participants from EPIC-NL; Overall = P value from relevant discovery stage studies combined with the replication stage P value using Fisher's method.
Figure 4
Figure 4. Regional association plots for novel loci identified.
All SNPs included in meta-analysis of the European discovery stage studies are represented by diamonds, with the lead SNP (lowest P value) at each locus represented by a large red diamond. Genes are represented as horizontal arrows, with the direction of the arrow reflecting the direction of transcription. Recombination rates are represented as vertical blue peaks based on the Hapmap 2 CEU population. P values are from fixed-effect meta-analysis. LD, represented as r2, is estimated using the controls from the BHF-FHS study, or Hapmap 2 CEU population where data were not available in BHF-FHS. Vertical dashed lines represent the extent of LD with the lead SNP, based on an r2 threshold of 0.5 in the Hapmap 2 CEU population. The genes between these lines represent the most likely candidate genes for each association signal.
Figure 5
Figure 5. Effects of novel CAD loci on known cardiovascular risk factors.
HDL-c = high-density lipoprotein cholesterol; LDL-c = low-density lipoprotein cholesterol; Beta/odds ratio = combined effect from meta-analysis of SNP versus blood pressure/lipids/T2D. Results for lipids from meta-analysis of 46 GWA studies containing up to 99,900 individuals . Results for blood pressure from the Global BPGen Consortium: a meta-analysis of 17 GWA studies containing 25,870 individuals . Results for diabetes from the DIAGRAM Consortium: a meta-analysis of 3 GWA studies containing 4,549 T2DM cases and 5,579 controls . * No results available due to poor quality of SNP imputation.
Figure 6
Figure 6. Evidence for an eQTL association in the LIPA gene.
Expression levels of LIPA in monocytes taken from 758 individuals assembled by the Cardiogenics Consortium partitioned by genotype of SNP rs2246833. Boxes indicate interquartile ranges with a white horizontal line indicating the median. Error bars represent absolute minimum and maximum levels with dots showing those levels considered to be outliers. rs2246833 is in strong linkage disequilibrium (r2 = 0.93; D′ = 1) with the CAD-associated variant at the LIPA locus (rs2246942). The T allele, which is associated with increased LIPA expression, is inherited with the G allele of rs2246942, which is associated with increased risk of coronary disease.
Figure 7
Figure 7. Novel loci identified in this study placed in the context of previously confirmed CAD loci.
Previously reported variants listed are those from the NHGRI GWA studies catalogue reported as having P<5×10⁻⁸ with CAD. Per-allele odds ratios and percentage risk allele frequencies (‘Freq’) are those listed in the catalogue. Frequencies and per-allele odds ratios for the novel variants reported in this study (appearing below the dashed line) are from the CARDIoGRAM replication stage.

References

    1. Wellcome Trust Case Control Consortium. Genome-wide association study of 14,000 cases of seven common diseases and 3,000 shared controls. Nature. 2007;447:661–678. - PMC - PubMed
    1. Samani NJ, Erdmann J, Hall AS, Hengstenberg C, Mangino M, et al. Genomewide association analysis of coronary artery disease. N Engl J Med. 2007;357:443–453. - PMC - PubMed
    1. Helgadottir A, Thorleifsson G, Manolescu A, Gretarsdottir S, Blondal T, et al. A common variant on chromosome 9p21 affects the risk of myocardial infarction. Science. 2007;316:1491–1493. - PubMed
    1. McPherson R, Pertsemlidis A, Kavaslar N, Stewart A, Roberts R, et al. A common allele on chromosome 9 associated with coronary heart disease. Science. 2007;316:1488–1491. - PMC - PubMed
    1. Kathiresan S, Voight BF, Purcell S, Musunuru K, Ardissino D, et al. Genome-wide association of early-onset myocardial infarction with single nucleotide polymorphisms and copy number variants. Nat Genet. 2009;41:334–341. - PMC - PubMed

Publication types