. 2011;6(9):e24772.
doi: 10.1371/journal.pone.0024772. Epub 2011 Sep 23.

Destruction of lymphoid organ architecture and hepatitis caused by CD4+ T cells

Affiliations

Destruction of lymphoid organ architecture and hepatitis caused by CD4+ T cells

Matthias S Matter et al. PLoS One. 2011.

Abstract

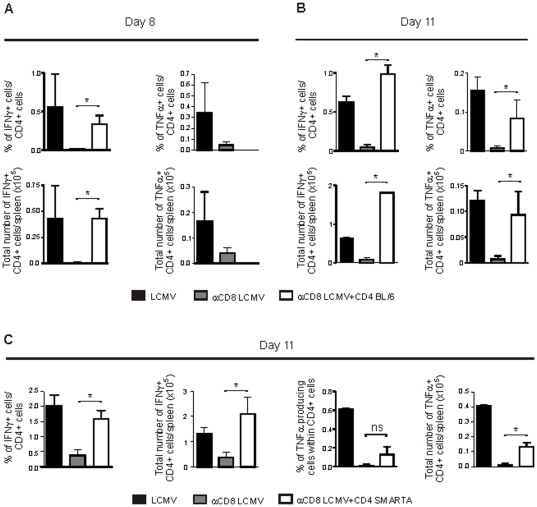
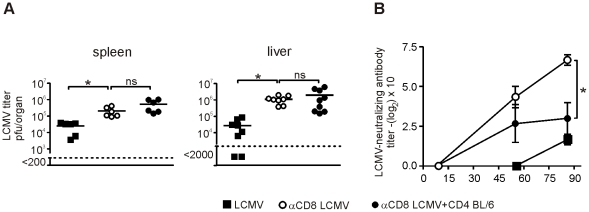
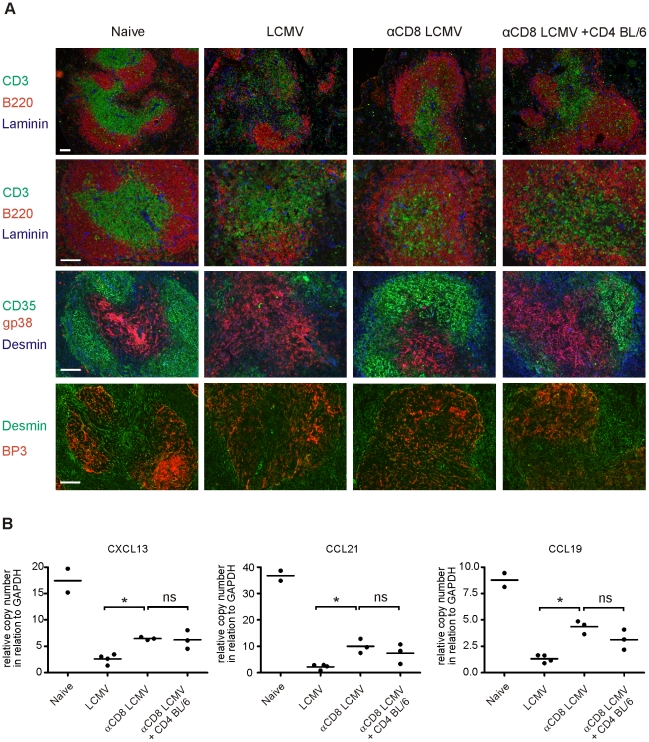
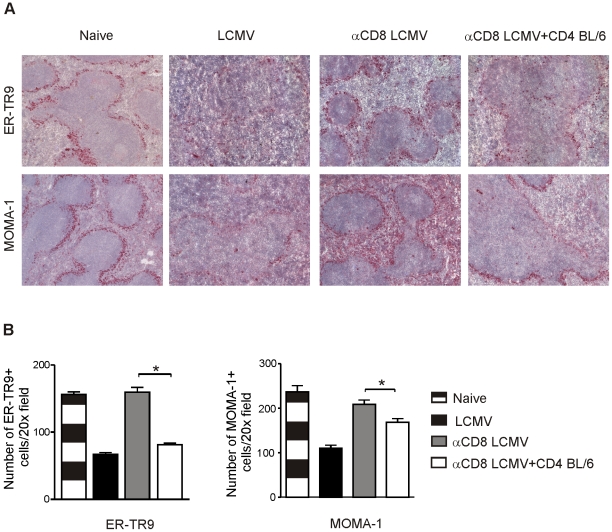
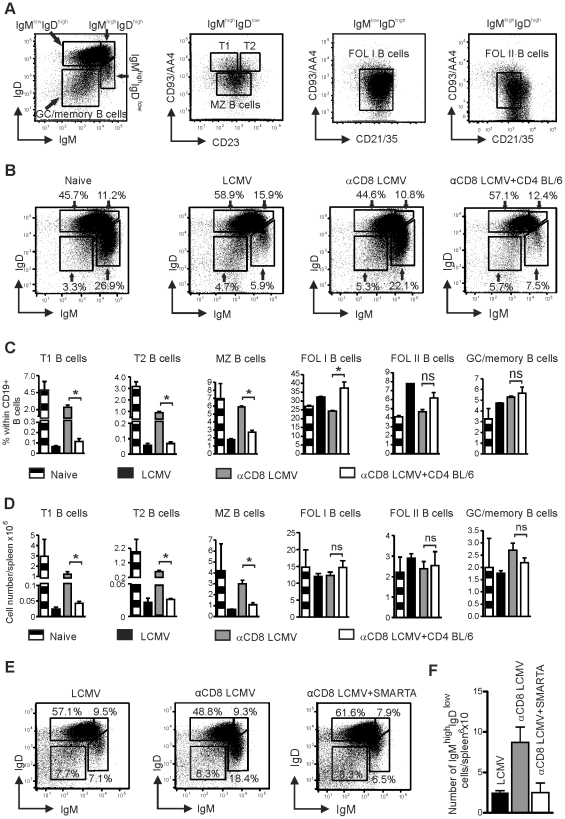
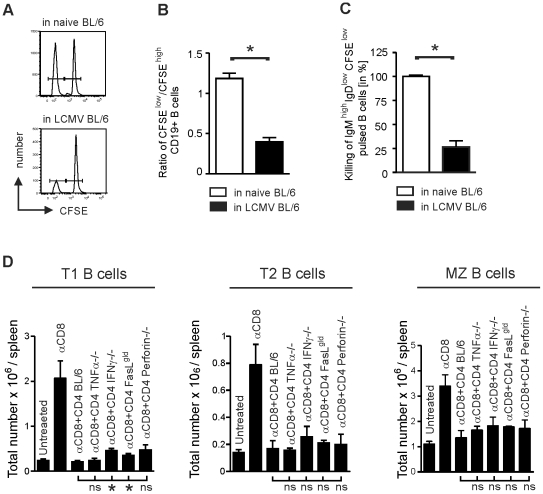
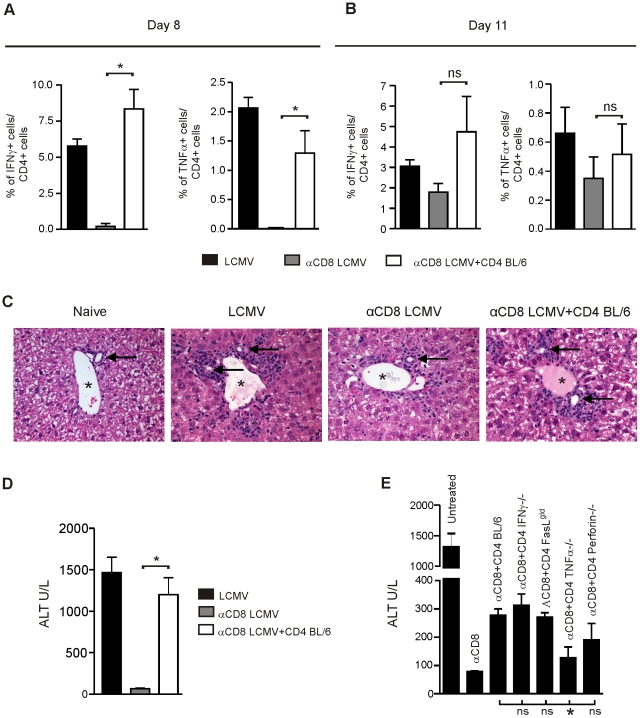
Immune responses have the important function of host defense and protection against pathogens. However, the immune response also causes inflammation and host tissue injury, termed immunopathology. For example, hepatitis B and C virus infection in humans cause immunopathological sequel with destruction of liver cells by the host's own immune response. Similarly, after infection with lymphocytic choriomeningitis virus (LCMV) in mice, the adaptive immune response causes liver cell damage, choriomeningitis and destruction of lymphoid organ architecture. The immunopathological sequel during LCMV infection has been attributed to cytotoxic CD8(+) T cells. However, we now show that during LCMV infection CD4(+) T cells selectively induced the destruction of splenic marginal zone and caused liver cell damage with elevated serum alanin-transferase (ALT) levels. The destruction of the splenic marginal zone by CD4(+) T cells included the reduction of marginal zone B cells, marginal zone macrophages and marginal zone metallophilic macrophages. Functionally, this resulted in an impaired production of neutralizing antibodies against LCMV. Furthermore, CD4(+) T cells reduced B cells with an IgM(high)IgD(low) phenotype (transitional stage 1 and 2, marginal zone B cells), whereas other B cell subtypes such as follicular type 1 and 2 and germinal center/memory B cells were not affected. Adoptive transfer of CD4(+) T cells lacking different important effector cytokines and cytolytic pathways such as IFNγ, TNFα, perforin and Fas-FasL interaction did reveal that these cytolytic pathways are redundant in the induction of immunopathological sequel in spleen. In conclusion, our results define an important role of CD4(+) T cells in the induction of immunopathology in liver and spleen. This includes the CD4(+) T cell mediated destruction of the splenic marginal zone with consecutively impaired protective neutralizing antibody responses.


Conflict of interest statement

Competing Interests: The authors have declared that no competing interests exist.

Figures

Figure 1
Figure 1. Model to study LCMV-specific CD4+ T cell responses in the absence of CD8+ T cells.
(A,B) BL/6 mice, BL/6 mice depleted of CD8+ T cells and BL/6 mice depleted of CD8+ T cells receiving 1.5×10⁷ purified LCMV-immune CD4+ T cells were infected with LCMV. On day 8 (A) and 11 (B) after infection, CD4+ splenocytes were restimulated in vitro for 5 h with GP61 and analyzed for intracellular IFNγ and TNFα production by flow cytometry. Mean ± SEM (error bars) is shown. For A n = 3 animals per group, for (B) n = 2–3 animals per group, representative of two independent experiments. (C) BL/6 mice, BL/6 mice depleted of CD8+ T cells and BL/6 mice depleted of CD8+ T cells receiving 107 naive SMARTA splenocytes were infected with LCMV. On day 11 after infection, CD4+ splenocytes were restimulated in vitro for 5 h with GP61 and analyzed for intracellular IFNγ and TNFα production by flow cytometry. Mean ± SEM (error bars) of 2–3 animals per group is shown.
Figure 2
Figure 2. Virus control by CD8+ and CD4+ T cells.
(A) BL/6 mice, BL/6 mice depleted of CD8+ T cells and BL/6 mice depleted of CD8+ T cells receiving 1.5×10⁷ purified LCM-immune CD4+ T cells were infected with LCMV. On day 11 after infection LCMV virus titer was determined in spleen and liver by plaque forming assay. Each symbol represents one mouse, data was pooled from 3 independent experiments. Horizontal bar indicates the mean. (B) BL/6 mice, BL/6 mice depleted of CD8+ T cells and BL/6 mice depleted of CD8+ T cells receiving 1.5×10⁷ purified LCMV-immune CD4+ T cells were infected with LCMV. Neutralizing antibodies against LCMV in the serum was analyzed on day 8, 55 and 86 after infection. Symbols represent mean ± SEM (n = 3).
Figure 3
Figure 3. Immunofluorescence analysis of B and T cell regions.
(A) BL/6 mice, BL/6 mice depleted of CD8+ T cells, and BL/6 mice depleted of CD8+ T cells receiving 1.5×10⁷ purified LCMV-immune CD4+ T cells were infected with LCMV. On day 11 after infection spleen sections were stained for CD3 (T cells; green), B220 (B cells; red), Laminin (blue), or CD35 (FDCs; green), gp38 (FRCs; red), Desmin (stromal cells, blue), or BP-3 (follicular stromal cells; red) and Desmin (green). One representative section of 3 mice per group is shown. BL/6 naïve mice served as control. Size bar represents 100 µm. The top row provides an overview with the rows below showing a higher magnification and consecutive sections. (B) The same experimental groups as in (A) were analyzed for the expression of CXCL13, CCL21, and CCL19 in the spleen by rtPCR. Each sample was analyzed in duplicate. Each symbol represents the mean of one animal. Horizontal bars indicate mean.
Figure 4
Figure 4. Immunohistochemistry analysis of the marginal zone.
(A,B) BL/6 mice, BL/6 mice depleted of CD8+ T cells, and BL/6 mice depleted of CD8+ T cells receiving 1.5×10⁷ purified LCMV-immune CD4+ T cells were infected with LCMV. On day 11 after infection, spleen sections were stained for ER-TR9 (MZM) and MOMA-1 (MOMA) and the number of ER-TR9 and MOMA-1 positive cells was counted. For (A) one representative section of 3 mice per group is shown. For (B) number was counted in each staining in at least 5 microscopic visual fields (20× magnification) per mouse (n = 3). Data expressed as mean ± SEM (error bar).
Figure 5
Figure 5. Analysis of the effect of CD4+ T cells on B cell subsets in spleen.
(A) Example of splenic B cell subtype analysis. Single cell suspension of the spleen was first gated on lymphocytes by forward and side scatter and afterwards on CD19+ B cells. CD19+ B cells were divided in IgMlowIgDlow GC/memory B cells, T1 B cells (CD19+IgMhighIgDlowCD93/AA4+CD23), T2 B cells (CD19+IgMhighIgDlowCD93/AA4+ CD23+), MZ B cells (CD19+IgMhighIgDlowCD93/AA4CD23), FOL I B cells (CD19+IgMlowIgDhighCD21/35int), and FOL II B cells (CD19+IgMhighIgDhighCD93/AA4−/lowCD21/35int) cells. (B–D) BL/6 mice, BL/6 mice depleted of CD8+ T cells and BL/6 mice depleted of CD8+ T cells receiving 1.5×10⁷ purified LCMV-immune CD4+ T cells were infected with LCMV. On day 11 after infection B cell subsets were analyzed as described in (A). (B) Analysis of IgM and IgD subtypes. Numbers indicate percentage (mean) within CD19+ B cells (n = 3 per group). (C) Percentage within CD19+ B cells and (D) absolute number of T1, T2, MZ, FOL I, and FOL II, and GC/memory B cells in the spleen. BL/6 naïve mice served as control. Mean ± SEM (error bars) of 3 animals per group is shown. For B–D, one representative experiment of 3 independent experiments is shown. (E, F) BL/6 mice, BL/6 mice depleted of CD8+ T cells and BL/6 mice depleted of CD8+ T cells receiving 1×10⁷ splenocytes of naïve SMARTA mice were infected with LCMV. On day 11 after infection, CD19+ splenocytes were analyzed for IgM and IgD subtypes. (E) Percentage (numbers indicate mean) within CD19+ B cells and (F) absolute number of IgMlowIgDhigh, IgMhighIgDhigh, IgMhighIgDlow and GC/memory B cells were determined per spleen. Mean ± SEM (error bars) of 2–3 animals per group are shown.
Figure 6
Figure 6. Effector mechanisms of CD4+ T cell-mediated immunopathology.
(A) Naïve B cells were pulsed with LCMV GP61 peptide and labelled with a low concentration of CFSE (CFSElow). Non-peptide pulsed naïve B cells were used as controls and labelled with a 10-times higher concentration of CFSE (CFSEhigh). CFSElow and CFSEhigh B cells were injected in a ratio of 1:1 to LCMV infected (day 11) BL/6 mice or naïve BL/6 mice and analyzed 18 hours later in the spleen by flow cytometry. (A) Representative example of each group. (B) The ratio of CFSElow/CFSEhigh CD19+ B cells was calculated. (C) Percentage of IgMhighIgDlow B cells within CD19+ B cells was determined. Values of naïve BL/6 mice were taken as 100%. (D) BL/6 mice, BL/6 mice depleted of CD8+ T cells, and BL/6 mice depleted of CD8+ T cells receiving 1.8×10⁵ LCMV-GP61-restricted IFNγ-producing splenocytes of BL/6, TNFα−/−, FasLgld or perforin−/− mice or 1.8×10⁵ LCMV-GP61-restricted TNFα-producing splenocytes of IFNγ−/− mice were infected with LCMV. Eleven days after infection the absolute number of T1, T2 and MZ B cells per spleen was analyzed in the spleen. Mean ± SEM (error bars) is shown (n = 3). Statistical analysis was calculated between mice receiving CD4+ T cells from BL/6 mice and mice receiving CD4+ T cells from TNFα−/−, IFNγ−/−, FasLgld or perforin−/− mice.
Figure 7
Figure 7. CD4+ T cell-mediated destruction of liver tissue.
(A–D) BL/6 mice, BL/6 mice depleted of CD8+ T cells and BL/6 mice depleted of CD8+ T cells receiving 1.5×10⁷ purified LCMV-immune CD4+ T cells i.v. at day 0, were all infected with LCMV. On day 8 (A) and 11 (B) after infection, CD4+ lymphocytes isolated from the liver were restimulated in vitro for 5 h with GP61 and analyzed for intracellular IFNγ and TNFα production by flow cytometry. (C) On day 11 after infection, liver sections (H&E staining) were analyzed. One representative example of 2–3 mice per group is shown. Image shows portal tract. Asterix: portal vein. Arrow: bile duct. (D) Level of ALT was measured in the serum. (E) BL/6 mice, BL/6 mice depleted of CD8+ T cells, and BL/6 mice depleted of CD8+ T cells receiving 1.8×10⁵ LCMV-GP61-restricted IFNγ-producing splenocytes of BL/6, TNFα−/−, FasLgld or perforin−/− mice or 1.8×10⁵ LCMV-GP61-restricted TNFα-producing splenocytes of IFNγ−/− mice were infected with LCMV. Eleven days after infection, level of ALT was measured in the serum. For (A,B,D,E) mean ± SEM of three mice per group are shown. Statistical analysis was calculated between mice receiving CD4+ T cells from BL/6 mice and mice receiving CD4+ T cells from TNFα−/−, IFNγ−/−, FasLgld or perforin−/− mice.

Similar articles

Cited by

References

    1. Odermatt BF, Eppler M, Leist TP, Hengartner H, Zinkernagel RM. Virus-triggered acquired immunodeficiency by cytotoxic T-cell- dependent destruction of antigen-presenting cells and lymph follicle structure. ProcNatlAcadSciUSA. 1991;88:8252–8256. - PMC - PubMed
    1. Zinkernagel RM, Haenseler E, Leist T, Cerny A, Hengartner H, et al. T cell-mediated hepatitis in mice infected with lymphocytic choriomeningitis virus. Liver cell destruction by H-2 class I-restricted virus-specific cytotoxic T cells as a physiological correlate of the 51Cr-release assay? J Exp Med. 1986;164:1075–1092. - PMC - PubMed
    1. Mebius RE, Kraal G. Structure and function of the spleen. Nat Rev Immunol. 2005;5:606–616. - PubMed
    1. Matter MS, Ochsenbein AF. Natural antibodies target virus-antibody complexes to organized lymphoid tissue. Autoimmun Rev. 2008;7:480–486. - PubMed
    1. Levesque MC, Moody MA, Hwang KK, Marshall DJ, Whitesides JF, et al. Polyclonal B cell differentiation and loss of gastrointestinal tract germinal centers in the earliest stages of HIV-1 infection. PLoS Med Jul 7; 2009;6(7):e1000107. - PMC - PubMed

Publication types

MeSH terms