. 2011;6(9):e25097.
doi: 10.1371/journal.pone.0025097. Epub 2011 Sep 26.

Fine-tuning roles of endogenous brain-derived neurotrophic factor, TrkB and sortilin in colorectal cancer cell survival

Affiliations

Fine-tuning roles of endogenous brain-derived neurotrophic factor, TrkB and sortilin in colorectal cancer cell survival

Hussein Akil et al. PLoS One. 2011.

Abstract

Background: Neurotrophin receptors were initially identified in neural cells. They were recently detected in some cancers in association with invasiveness, but the function of these tyrosine kinase receptors was not previously investigated in colorectal cancer (CRC) cells.

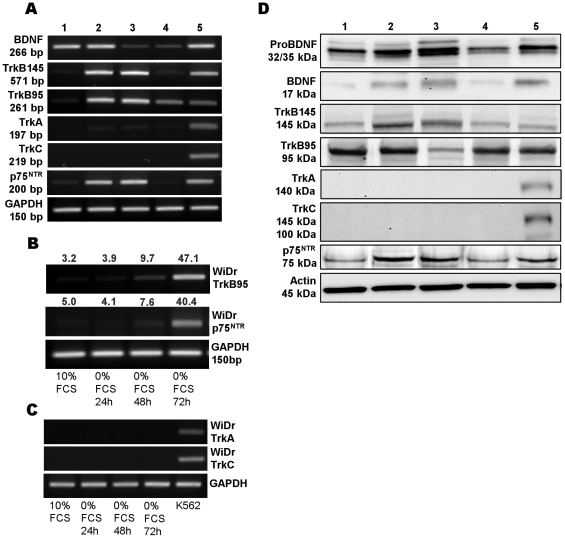
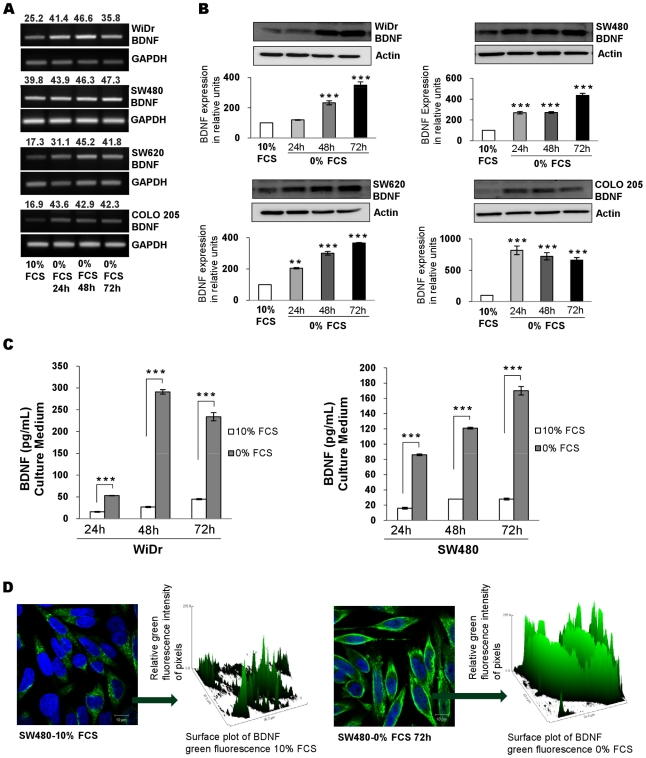
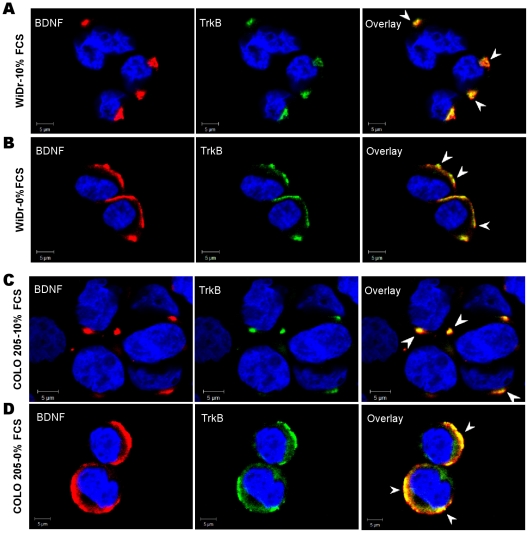
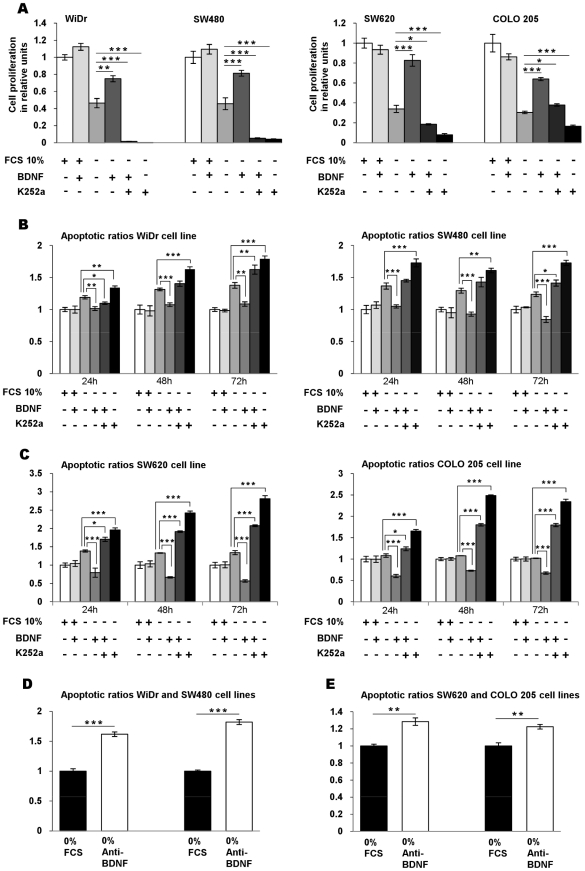
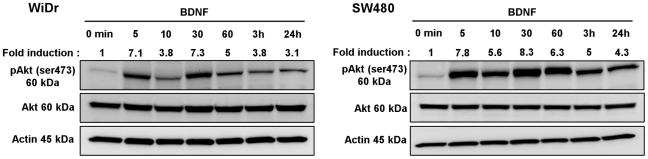
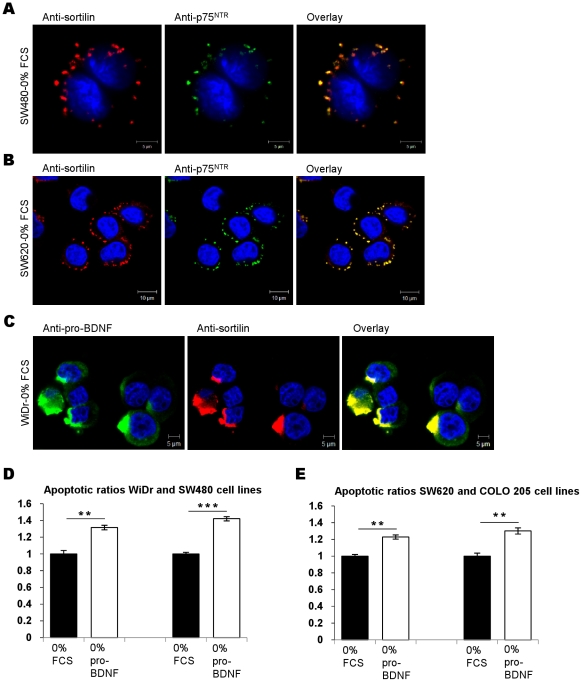
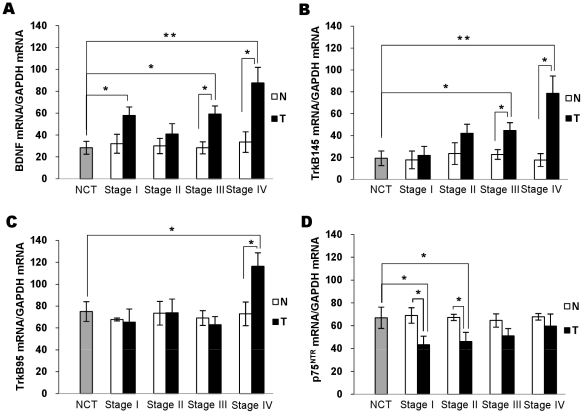
Methods and findings: We report herein that human CRC cell lines synthesize the neural growth factor Brain-derived neurotrophic factor (BDNF) under stress conditions (serum starvation). In parallel, CRC cells expressed high- (TrkB) and low-affinity (p75(NTR)) receptors at the plasma membrane, whereas TrkA and TrkC, two other high affinity receptors for NGF and NT-3, respectively, were undetectable. We demonstrate that BDNF induced cell proliferation and had an anti-apoptotic effect mediated through TrkB, as assessed by K252a, a Trk pharmacologic inhibitor. It suppressed both cell proliferation and survival of CRC cells that do not express TrkA nor TrkC. In parallel to the increase of BDNF secretion, sortilin, a protein acting as a neurotrophin transporter as well as a co-receptor for p75(NTR), was increased in the cytoplasm of primary and metastatic CRC cells, which suggests that sortilin could regulate neurotrophin transport in these cells. However, pro-BDNF, also detected in CRC cells, was co-expressed with p75(NTR) at the cell membrane and co-localized with sortilin. In contrast to BDNF, exogenous pro-BDNF induced CRC apoptosis, which suggests that a counterbalance mechanism is involved in the control of CRC cell survival, through sortilin as the co-receptor for p75(NTR), the high affinity receptor for pro-neurotrophins. Likewise, we show that BDNF and TrkB transcripts (and not p75(NTR)) are overexpressed in the patients' tumors by comparison with their adjacent normal tissues, notably in advanced stages of CRC.

Conclusion: Taken together, these results highlight that BDNF and TrkB are essential for CRC cell growth and survival in vitro and in tumors. This autocrine loop could be of major importance to define new targeted therapies.


Conflict of interest statement

Competing Interests: The authors have declared that no competing interests exist.

Figures

Figure 1
Figure 1. Expression of BDNF and its receptors in human CRC cell lines.
(A): RT-PCR of BDNF, its high (TrkB) and low (p75NTR) affinity receptors, TrkA, and TrkC from cells cultured in basal (10% FCS medium), WiDr (lane: 1), SW480 (lane: 2), SW620 (lane: 3), COLO 205 (lane: 4). GAPDH mRNA levels was used as an internal control. Positive control (lane 5) was the neuroblastoma cell line (IMR32) for BDNF, TrkB and p75NTR; and the erythromyeloblastoid leukemia cells (K562) for TrkA and C. A representative result of at least three to five independent experiments. (B) Comparison of TrkB95 and p75NTR on total RNA extracted from WiDr cells cultured in 10% FCS or after 24 to 72 h serum deprivation (0% FCS). TrkB95 and p75NTR mRNA/GAPDH mRNA quantification of band intensities evaluated by densitometry are shown above lanes and expressed in arbitrary units (mean of three independent experiments). (C) Same experiment: RT-PCR of TrkA and TrkC on total RNA extracted from WiDr cells cultured under basal culture conditions (10% FCS) and after 24–72 h of serum starvation in comparison to positive control (K562) (D) Expression of pro-BDNF and BDNF, full length TrkB 145 and truncated TrkB 95 and p75NTR proteins in CRC cell lines cultured in 10% FCS. TrkA and TrkC were not detected. Actin was used as loading protein control. WiDr (lane: 1), SW480 (lane: 2), SW620 (lane: 3), COLO 205 (lane: 4). Positive control (lane: 5) were IMR32 cells for BDNF, pro-BDNF, TrkB and p75NTR and K562 cells or TrkA and TrkC. A representative result of at least three independent experiments.
Figure 2
Figure 2. Comparison of BDNF production in CRC cells cultured with 10% or without FCS (0% FCS).
(A) BDNF production assessed by RT-PCR of total RNA extracted from cells cultured in basal condition (10% FCS) and for 24 to 72 h of serum deprivation. Quantification of band intensities is shown as above (mean of three independent experiments). (B) BDNF expression by western blotting (in reference to actin) in total cellular protein extracted from cell lines cultured under basal condition (10% FCS) and after 24–72 h of serum deprivation (0% FCS). According to densitometric analyses, quantification showed a significant increased expression of BDNF in cultured cells. Histograms are means ± SEM of at least three independent experiments. **, p<0.01; ***, p<0.001, in comparison with basal culture conditions. (C) Secretion of BDNF assessed by ELISA in supernatant of the WiDr and SW480 cell lines under basal condition (10% FCS) and after 24–72 h of serum deprivation (0% FCS). Results are expressed as the mean ±SEM of triplicates from three different experiments. ***, p<0.001, when compared with basal culture condition. (D) Comparison of BDNF expression by SW480 cells cultured in 10% FCS and after 72-h serum deprivation. Confocal microscopy with anti-BDNF Ab and Alexa fluor-488 conjugate (green) and nuclei counter stained with the blue-fluorescent DNA stain DAPI. Relative quantification was assessed by green fluorescence surface plot. Images were representative for at least three independent experiments. Scale bars, 10 µm. Similar results were observed with the three other lines (data not shown).
Figure 3
Figure 3. Membranous and cytoplasmic expression of BDNF and TrkB depending on culture conditions.
Confocal microscopy of WiDr (A, B) and COLO 205 (C, D) cells, stained with an anti-BDNF Ab (red), anti-TrkB mAb (green) or both (overlay) cultured with 10% FCS (A, C) or after 24-h serum deprivation (B, D). Under basal culture conditions (10% FCS), TrkB and BDNF were sequestered in the cytoplasm (arrows) in WiDr (A) and COLO 205 (C) cells. The same staining patterns were obtained with the two other cell lines (data not shown). After serum starvation relocation to the cell membrane and colocalization of TrkB and BDNF (yellow in merged, arrows) were detected in WiDr (B) and COLO 205 (D). Images were representative for at least three to five independent experiments.
Figure 4
Figure 4. BDNF-TrkB promotes the cell survival of CRC cell lines.
(A) Role of endogenous BDNF and its receptor TrkB on CRC cell proliferation: effects of exogenous BDNF and suppressing endogenous TrkB receptor on cell proliferation. The four cell lines were cultured for 24 h in FCS-free medium (FCS 10%, −) in the presence of exogenous BDNF (+), K252a (+) alone or in combination. Cell proliferation was determined by flow cytometry analysis using EdU Alexa Fluor 488. The data are presented as histograms of proliferating cells in relative units ± SEM of five independent experiments. *, p<0.05; **, p<0.01; ***, p<0.001, when compared with serum-free medium. (B, C) Effects of exogenous BDNF and suppressing endogenous TrkB receptor on cell survival. Apoptotic ratios of soluble nucleosomes were detected by ELISA Cell for WiDr, SW480, SW620, and COLO 205 induced by serum deprivation alone (FCS 10%, −) or in association either with exogenous BDNF (+), or with K252a (+), during 24–72 h of serum deprivation. Histograms, mean ratio of apoptotic cells ± SEM of at least three independent experiments. *, p<0.05; **, p<0.01; ***, p<0.001, when compared with serum-free condition alone. (D, E) apoptotic ratio after 24 h serum deprivation alone (0% FCS) or with combination with a neutralizing anti-BDNF mAb (0% anti-BDNF). Histograms, mean ratio of apoptotic cells ± SEM of three independent experiments. *, p<0.05; **, p<0.01; ***, p<0.001, when compared with serum-free condition alone.
Figure 5
Figure 5. BDNF triggers phosphorylation of Akt in serum-starved CRC cell lines.
The ability of BDNF to activate PI3-kinase/Akt signaling pathway in CRC cells was assessed using antibodies specific to Akt and phospho-Akt (pAkt). WiDr and SW480 cells were serum starved for 16 h. The cells were then exposed to BDNF (100 ng/ml) and harvested at different times, for 5 minutes (min) to 24 hours (h). Thirty µg of protein lysates was analyzed for pAkt (Ser473) and total Akt by western blot analysis. The density of each pAkt band was corrected for variance in loading, using the density of the corresponding total Akt. The fold induction was evaluated as the ratio of phosphorylated Akt protein densities between control (0 min) and treated cells. A representative result of at least three independent experiments.
Figure 6
Figure 6. Sortilin expression by CRC cell lines.
(A) Sortilin detection by RT-PCR of total RNA extracted from cells cultured in 10% FCS and after 24–72 h serum starvation. Expression was controlled with specific primers for its extracellular (Sortilin EC) and intracellular (Sortilin IC) parts. A Representative result from at least three independent experiments. (B) Assessment by western blotting of sortilin expression (in reference to actin) in total cellular protein extracted from studied cell lines cultured under basal condition and after 24–72 h of serum deprivation. According to densitometric analyses, quantification showed a significant increased expression of sortilin in cultured cells. Histograms are means ± SEM of at least three independent experiments. *, p<0.05; **, p<0.01; ***, p<0.001, when compared with basal culture condition (10% FCS). (C) Confocal microscopy of SW620 cells stained with an anti-BDNF Ab (green) and an anti-Sortilin Ab (red) and double staining (merged) in basal culture condition and after 24 h serum starvation. Relative quantification was assessed by green and red fluorescence surface plot. Images were representative for at least three independent experiments. Scale bars, 10 µm. Similar results were observed with the three other lines (data not shown).
Figure 7
Figure 7. Relationship between pro-BDNF, sortilin, p75NTR and apoptosis.
(A, B) Sortilin as a coreceptor of p75NTR. Double staining (yellow) of sortilin (red) and p75NTR (green) in SW480 cells (A) and SW620 (B) after 24 h of serum deprivation. (C) Colocalization of pro-BDNF and sortilin. Confocal microscopy study of a WiDr cells stained with an anti-pro-BDNF Ab (green) and an anti-sortilin Ab (red), and double staining (yellow) after 24 h of serum deprivation. (D, E) apoptotic ratios after 24 h serum deprivation alone (0% FCS) or combined with recombinant Pro-BDNF (0% Pro-BDNF). Histograms, mean ratio of apoptotic cells ± SEM of three independent experiments. *, p<0.05; **, p<0.01; ***, p<0.001, when compared with serum-free condition alone (0% FCS).
Figure 8
Figure 8. BDNF and its receptors are expressed in colorectal cancer tissues.
RT-PCR analysis of BDNF (A), its two high TrkB145 and TrkB95 (B, C, respectively), and low p75NTR.(D) affinity receptors in total mRNA extracted from 16 surgically resected primary and metastatic colon adenocarcinoma specimens. N, non-tumor tissue (n = 16); T, tumor tissue (n = 16); NCT, noncancerous tissue (n = 4). Histograms, mean percentage of each amplified mRNA/GAPDH expression of band intensities evaluated by densitometry. Statistical significance:* p<0.05; ** p<0.01.

References

    1. Arevalo JC, Wu SH. Neurotrophin signaling: many exciting surprises! Cell Mol Life Sci. 2006;63:1523–1537. - PMC - PubMed
    1. Seidah NG, Benjannet S, Pareek S, Chretien M, Murphy RA. Cellular processing of the neurotrophin precursors of NT3 and BDNF by the mammalian proprotein convertases. FEBS Lett. 1996;379:247–250. - PubMed
    1. Rose CR, Blum R, Pichler B, Lepier A, Kafitz KW, et al. Truncated TrkB-T1 mediates neurotrophin-evoked calcium signalling in glia cells. Nature. 2003;426:74–78. - PubMed
    1. Carim-Todd L, Bath KG, Fulgenzi G, Yanpallewar S, Jing D, et al. Endogenous truncated TrkB.T1 receptor regulates neuronal complexity and TrkB kinase receptor function in vivo. J Neurosci. 2009;29:678–685. - PMC - PubMed
    1. Strohmaier C, Carter BD, Urfer R, Barde YA, Dechant G. A splice variant of the neurotrophin receptor trkB with increased specificity for brain-derived neurotrophic factor. EMBO J. 1996;15:3332–3337. - PMC - PubMed

Publication types

MeSH terms