

Comparison of electronic data capture (EDC) with the standard data capture method for clinical trial data
- PMID: 21966505
- PMCID: PMC3179496
- DOI: 10.1371/journal.pone.0025348
Comparison of electronic data capture (EDC) with the standard data capture method for clinical trial data
Abstract
Background: Traditionally, clinical research studies rely on collecting data with case report forms, which are subsequently entered into a database to create electronic records. Although well established, this method is time-consuming and error-prone. This study compares four electronic data capture (EDC) methods with the conventional approach with respect to duration of data capture and accuracy. It was performed in a West African setting, where clinical trials involve data collection from urban, rural and often remote locations.
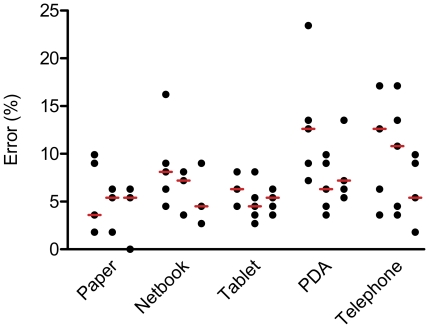
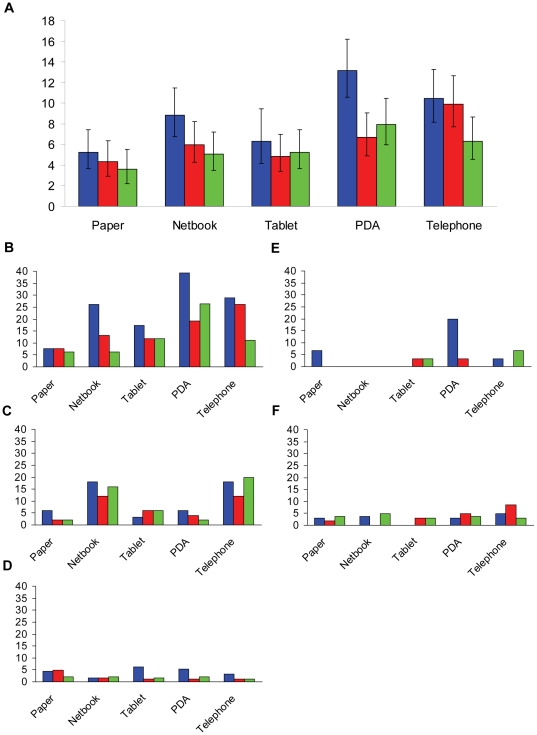
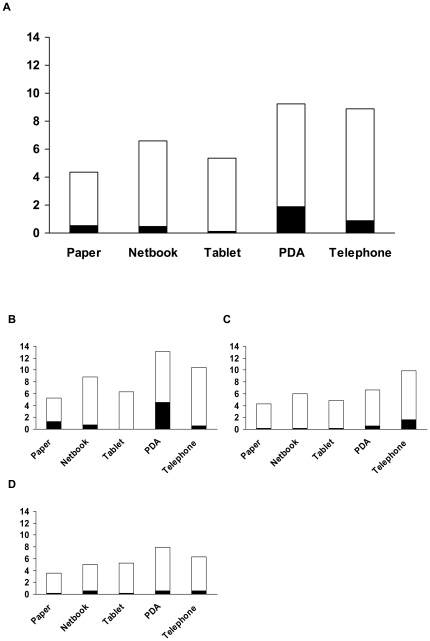
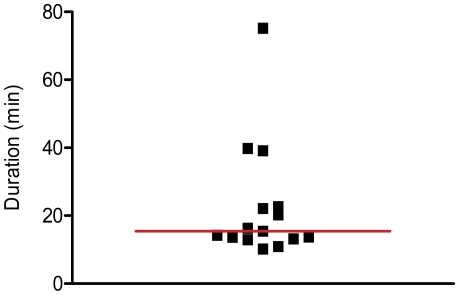
Methodology/principal findings: Three types of commonly available EDC tools were assessed in face-to-face interviews; netbook, PDA, and tablet PC. EDC performance during telephone interviews via mobile phone was evaluated as a fourth method. The Graeco Latin square study design allowed comparison of all four methods to standard paper-based recording followed by data double entry while controlling simultaneously for possible confounding factors such as interview order, interviewer and interviewee. Over a study period of three weeks the error rates decreased considerably for all EDC methods. In the last week of the study the data accuracy for the netbook (5.1%, CI95%: 3.5-7.2%) and the tablet PC (5.2%, CI95%: 3.7-7.4%) was not significantly different from the accuracy of the conventional paper-based method (3.6%, CI95%: 2.2-5.5%), but error rates for the PDA (7.9%, CI95%: 6.0-10.5%) and telephone (6.3%, CI95% 4.6-8.6%) remained significantly higher. While EDC-interviews take slightly longer, data become readily available after download, making EDC more time effective. Free text and date fields were associated with higher error rates than numerical, single select and skip fields.
Conclusions: EDC solutions have the potential to produce similar data accuracy compared to paper-based methods. Given the considerable reduction in the time from data collection to database lock, EDC holds the promise to reduce research-associated costs. However, the successful implementation of EDC requires adjustment of work processes and reallocation of resources.
Conflict of interest statement
Figures
References
-
- U.S. Department of Health & Human Services. The Health Insurance Portability and Accountability Act (HIPPA) Privacy and Security Rules. 1996. Available: http://www.hhs.gov/ocr/privacy/. Accessed: 2010 May 05.
-
- U.S. Department of Health & Human Services. The Patient Safety and Quality Improvement Act (PSQIA). 2005. Available: http://www.hhs.gov/ocr/privacy/. Accessed: 2010 May 05.
-
- European Parliament. Directive 2002/58/EC of the European Parliament and of the Council of 12 July 2002 concerning the processing of personal data and the protection of privacy in the electronic communications sector (Directive on privacy and electronic communications). 2002. Available: http://eur-lex.europa.eu/LexUriServ/LexUriServ.do?uri=CELEX:32002L0058:E.... Accessed: 2010 May 04.
-
- U.S. Department of Health and Human Services (FDA) Guidance for Industry - Computerized Systems Used in Clinical Investigations. 2007. Available: http://www.fda.gov/OHRMS/DOCKETS/98fr/04d-0440-gdl0002.PDF. Accessed: 2010 May 05.
-
- Food and Drug Adminstration (FDA) Code of Federal Regulations Title 21, Part 11 Electronic Records: Electronic Signatures. 2009. Available: http://www.accessdata.fda.gov/scripts/cdrh/cfdocs/cfCFR/CFRSearch.cfm?CF.... Accessed: 2010 May 04.
Publication types
MeSH terms
LinkOut - more resources
Full Text Sources
