. 2011 Oct;4(5):282-92.
doi: 10.1593/tlo.11133. Epub 2011 Oct 1.

Role of α(5)β(1) Integrin Up-regulation in Radiation-Induced Invasion by Human Pancreatic Cancer Cells

Affiliations

Role of α(5)β(1) Integrin Up-regulation in Radiation-Induced Invasion by Human Pancreatic Cancer Cells

Hongren Yao et al. Transl Oncol. 2011 Oct.

Abstract

RADIOTHERAPY IS USED IN THE MANAGEMENT OF PANCREATIC CANCER BECAUSE OF ITS HIGH PROPENSITY FOR LOCOREGIONAL RELAPSE: one third of patients succumb to localized disease. Thus, strategies to improve the efficacy of radiotherapy in pancreatic cancer are important to pursue. We used naturally serum-free, selectively permeable basement membranes and confocal microscopy of fluorescent antibody-stained human Panc-1, MiaPaCa-2, and BxPC-3 pancreatic cancer cell lines to investigate the effects of ionizing radiation on α(5)β(1) integrin fibronectin receptor expression and on α(5)β(1)-mediated invasion. We report that radiation rapidly induces pancreatic cancer cell invasion, and that radiation-induced invasion is caused by up-regulation of α(5)β(1) integrin fibronectin receptors by transcriptional and/or postendocytic recycling mechanisms. We also report that radiation causes α(5)β(1) up-regulation in Panc-1, MiaPaCa-2, and BxPC-3 tumor xenografts and that upregulated α(5)β(1) colocalizes with upregulated early or late endosomes in Panc-1 or BxPC-3 tumors, respectively, although it may colocalize significantly with both endosome types in MiaPaCa-2 tumors. Our results suggest that systemic inhibition of α(5)β(1)-mediated invasion might be an effective way to reduce radiation-induced pancreatic cancer cell invasion, thereby improving the efficacy of radiotherapy.


Figures

Figure 1
Figure 1
Radiation-induced invasion dose responses, time courses and dependence on pFn, α5β1 integrin, and MMP-1. (A) Dose responses. x axis indicates radiation doses (Gy); y axis, relative percent invasion compared with unirradiated controls. Black circles indicate BxPC-3; black triangles, MiaPaCa-2; white circles, Panc-1. (B) Time courses. Doses: Panc-1, 2 Gy; MiaPaCa-2, 3 Gy; BxPC-3, 3 Gy. x axis indicates hours because radiation; y axis, relative percent invasion compared with unirradiated controls. Black circles indicate BxPC-3; black triangles, MiaPaCa-2; white circles, Panc-1. (C) pFn, α5β1, and MMP-1 dependence. x axis indicates treatment groups. pFn, 5 µg/ml; FBS, 10%; anti-α5β1, 300 µg/ml; anti-α3β1, 300 µg/ml; anti-MMP-1, 100 µg/ml; anti-MMP-2, 100 µg/ml; anti-MMP-9, 100 µg/ml. y axis indicates relative percent invasion compared with unirradiated controls. Black bars indicate BxPC-3; gray bars, MiaPaCa-2; white bars, Panc-1. (A–C) Data are normalized to unirradiated controls and are the means ± first SDs of values from n = 3 experiments, each run in triplicate. Significance was set at P < .05.
Figure 2
Figure 2
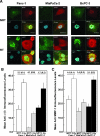
Radiation-induced surface α5β1 and MMP-1 up-regulation. Panc-1, MiaPaCa-2, and BxPC-3 cells were treated with the indicated doses of radiation (RT) or without (NRT) and then fixed and stained with primary antibodies recognizing α5β1 or MMP-1, fluorescent secondary antibodies, and DAPI. (A) Representative examples. α5β1 indicates anti-α5β1; DAPI, nuclear DNA; MMP1, anti-MMP-1; NRT, no radiation treatment; RT, 1 hour after radiation. (B) Anti-α5β1 IF levels from three experiments. x axis indicates treatments and cell lines: 2 Gy, Panc-1; 3 Gy, MiaPaCa-2, 3 Gy, BxPC-3. NRT indicates no radiation treatment. y axis indicates mean anti-α5β1 IF levels (±SEM). Mean fold up-regulation of surface immunofluorescence levels in irradiated versus unirradiated cells (±SD) are indicated. Significance was set at P < .05. (C) Anti-MMP-1 IF levels from three experiments. x axis indicates treatments and cell lines: 2 Gy, Panc-1; 3 Gy, MiaPaCa-2, 3 Gy, BxPC-3. NRT indicates no radiation treatment. y axis indicates mean anti-MMP-1 immunofluorescence levels (±SEM). Mean fold up-regulation (±SD) are shown at the top. P < .05.
Figure 3
Figure 3
Effects of radiation on α5 integrin subunit and MMP-1 mRNA levels: Panc-1 (A), MiaPaCa-2 (B), and BxPC-3 cells (C). x axes indicate dose in gray; y axes, mean relative mRNA levels (±SEM) for experiments run and repeated in triplicate. Black bars indicates α5 mRNA; gray bars, MMP-1 mRNA. Significance was set at P < .05.
Figure 4
Figure 4
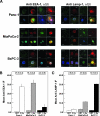
Effects of radiation on anti-EEA-1 and anti-LAMP-1 immunostaining and colocalization with anti-α5β1. (A) Examples of unirradiated and radiated Panc-1, MiaPaCa-2, and BxPC-3 cells coimmunostained with anti-EEA-1 MAb (EEA-1) and anti-α5β1 antiserum (α5 Serum) or with anti-LAMP-1 MAb (LAMP-1) and anti-α5β1 MAb (α5β1). (B) Effects of radiation on anti-EEA-1 IF levels. Black bars indicate BxPC-3; gray bars, MiaPaCa-2; white bars, Panc-1. All values listed were each made on four plates containing hundreds of cells, for each of two independent experiments. x axis indicates treatments and cell lines. NRT indicates no radiation treatment; 2GY, 1 hour after a single 2-Gy dose; 3GY, 1 hour after a single 3-Gy dose. y axis indicates mean anti-EEA-1 IF (±SEM). Mean fold up-regulation (±SD) shown at the top. Significance was set at P < .05. (C) Effects of radiation on anti-LAMP-1 IF. Black bars indicate BxPC-3; gray bars, MiaPaCa-2; white bars, Panc-1. All values listed were each made on four plates containing hundreds of cells, for each of two independent experiments. x axis indicates treatments and cell lines. NRT indicates no radiation treatment; 2GY, 1 hour after a single 2-Gy dose; 3GY, 1 hour after a single 3-Gy dose. y axis indicates mean anti-LAMP-1 IF (±SEM). Mean fold up-regulation (±SD) shown at the top. P < .05.
Figure 5
Figure 5
Effects of radiation and primaquine treatment on radiation-induced anti-α5β1, EEA-1, and LAMP-1 immunostaining and on radiation-induced invasion. (A) IF levels of anti-EEA-1, anti-LAMP-1, and anti-α5β1 immunostained cells. x axis indicates cells and antisera; y axis, mean IF levels (±SEM). Black bars indicate 1 hour after radiation and primaquine treatment; dark gray bars, 4 hours after radiation; light gray bars, 1 hour after radiation; medium gray bars, 2 hours after radiation; white bars, unirradiated cells. Radiation doses: Panc-1, 2 Gy; MiaPaCa-2, 3 Gy; BxPC-3, 3 Gy. Mean IF levels shown (±SEM). All values were obtained from hundreds of cells on four independent plates for each experiment, and each experiment was repeated twice. Significance was set at P < .05. (B) Effects of primaquine on radiation-induced Panc-1 invasion in vitro. (C) Effects of primaquine in radiation-induced MiaPaCa-2 invasion in vitro. (D) Effects of primaquine on radiation-induced BxPC-3 invasion in vitro. Panels B, C, and D: x axes indicate treatments. NRT indicates no radiation treatment; Prim, primaquine; RT, 1 hour after radiation treatment (Panc-1, 2 Gy; MiaPaCa-2 and BxPC-3, 3 Gy). y axes indicate mean percentages of cells invaded (±SD) relative to NRT. Values obtained from quadruplicate plates for each condition, in each of three separate experiments. P < .05.
Figure 6
Figure 6
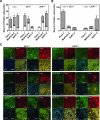
Effects of radiation on α5β1, EEA-1, and LAMP-1 up-regulation and colocalization in Panc-1, MiaPaCa-2, and BxPC-3 tumors in athymic nude mice. (A) Up-regulation of α5β1, EEA-1, or LAMP-1 fluorescent immunostaining in irradiated Panc-1, MiaPaCa-2, and BxPC-3 tumors. x axis indicates tumors. Gray bars are sections from irradiated Panc-1, MiaPaCa-2, and BxPC-3 tumors; white bars are sections from unirradiated Panc-1, MiaPaCa-2, and BxPC-3 tumors; white and gray bars are shown as superimposed. y axis indicates the mean number of positive cells (±SEM), exhibiting anti-α5β1, anti-EEA-1, or anti-LAMP-1 IF in greater than 70% of the cytoplasmic area for each cell. Each mean value shown was obtained from all cells in 30 sections, each separated by 50 µm, for each of five irradiated and five unirradiated tumors, for a total of 150 sections per tumor. Tumor areas scored were located from 0 to 75 µm from the edges of the tumors, as defined by the presence of microvasculature and/or connective tissue. Significance was set at P < .05. (B) Colocalization of upregulated α5β1 and EEA-1 or upregulated α5β1 and LAMP-1 fluorescent immunostaining in irradiated Panc-1, MiaPaCa-2, and BxPC-3 tumors. x axis indicates tumors. Bars are shown as superimposed; gray bars are sections from irradiated Panc-1, MiaPaCa-2, or BxPC-3 tumors; white bars are sections from unirradiated Panc-1, MiaPaCa-2, or BxPC-3 tumors. y axis indicates mean number of positive cells (±SEM), containing colocalized (yellow), anti-α5β1 and anti-EEA-1, or anti-α5β1 and anti-LAMP-1 immunofluorescence in greater than 70% of the cytoplasmic area for each cell. Each mean value shown was obtained from all cells in 30 sections, each separated by 50 µm, for each of nine irradiated and nine unirradiated tumors, for a total of 150 sections per tumor. Significance was set at P < .05. (C) Examples of anti-EEA-1 and anti-α5β1 or anti-LAMP-1 and anti-α5β1 immunostained Panc-1, MiaPaCa-2, or BxPC-3 tumor sections. Sections were photographed at 0 to 75 µm from the edge. α5β1 indicates anti-α5β1 primary MAb; DAPI, nuclear DNA; EEA-1, anti-EEA-1 primary Ab (antiserum); LAMP-1, anti-LAMP-1 primary Ab; NRT, no radiation treatment; RT, radiation treatment (a total of five daily 2-Gy doses).

References

    1. Iacobuzio-Donahue CA, Fu B, Yachida S, Luo M, Abe H, Henderson CM, Vilardell F, Wang Z, Keller JW, Banerjee P, et al. DPC4 gene status of the primary carcinoma correlates with patterns of failure in patients with pancreatic cancer. J Clin Oncol. 2009;27:1806–1813. - PMC - PubMed
    1. Cardenes HR, Chiorean EG, Dewitt J, Schmidt M, Loehrer P. Locally advanced pancreatic cancer: current therapeutic approach. Oncologist. 2006;11:612–623. - PubMed
    1. Chang BW, Siccion E, Saif MW. Updates in locally advanced pancreatic cancer. Highlights from the “2010 ASCO Annual Meeting”. Chicago, IL, USA June 4–8, 2010. JOP. 2010;11:313–316. - PubMed
    1. Baluna RG, Eng TY, Thomas CR. Adhesion molecules in radiotherapy. Radiat Res. 2006;166:819–831. - PubMed
    1. Wild-Bode C, Weller M, Rimner A, Dichgans J, Wick W. Sublethal irradiation promotes migration and invasiveness of glioma cells: implications for radiotherapy of human glioblastoma. Cancer Res. 2001;61:2744–2750. - PubMed

LinkOut - more resources