. 2011 Oct 24;208(11):2263-77.
doi: 10.1084/jem.20110560. Epub 2011 Oct 3.

Transcytosis of Listeria monocytogenes across the intestinal barrier upon specific targeting of goblet cell accessible E-cadherin

Affiliations

Transcytosis of Listeria monocytogenes across the intestinal barrier upon specific targeting of goblet cell accessible E-cadherin

Georgios Nikitas et al. J Exp Med. .

Abstract

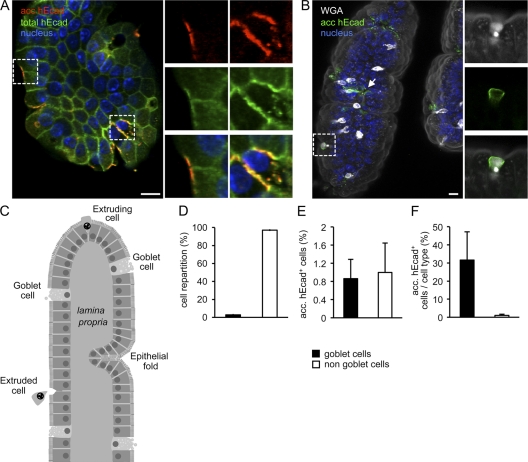
Listeria monocytogenes (Lm) is a foodborne pathogen that crosses the intestinal barrier upon interaction between its surface protein InlA and its species-specific host receptor E-cadherin (Ecad). Ecad, the key constituent of adherens junctions, is typically situated below tight junctions and therefore considered inaccessible from the intestinal lumen. In this study, we investigated how Lm specifically targets its receptor on intestinal villi and crosses the intestinal epithelium to disseminate systemically. We demonstrate that Ecad is luminally accessible around mucus-expelling goblet cells (GCs), around extruding enterocytes at the tip and lateral sides of villi, and in villus epithelial folds. We show that upon preferential adherence to accessible Ecad on GCs, Lm is internalized, rapidly transcytosed across the intestinal epithelium, and released in the lamina propria by exocytosis from where it disseminates systemically. Together, these results show that Lm exploits intrinsic tissue heterogeneity to access its receptor and reveal transcytosis as a novel and unanticipated pathway that is hijacked by Lm to breach the intestinal epithelium and cause systemic infection.


Figures

Figure 1.
Figure 1.
Lm rapidly crosses the epithelium of iFABP-hEcad transgenic mice in an InlA-dependent manner. (A) Intestinal tissue of iFABP-hEcad transgenic mice was fixed, permeabilized, and stained for F-actin and hEcad. A three-dimensional reconstruction of an intestinal villus is shown. (B) Three-dimensional reconstruction of an intestinal villus of iFABP-hEcad transgenic mouse infected with 109 Lm for 45 min and stained for hEcad and nuclei. (C) Optical sections and insets show Lm (asterisks) interacting with intestinal villus along its length (z in micrometers corresponds to distance from villus tip). Insets are a magnification of Lm (indicated by asterisks) interacting with intestinal villus epithelial cells or inside the lamina propria. Bars, 10 µm. (D) Quantification of Lm associated with intestinal villus (***, P < 0.001, as assessed by two-way analysis of variance and Tukey adjustment). Error bars indicate SD. n = 10 villi from three mice. (E, left) Longitudinal section of a villus on which planes along its z axis are depicted. (right) Quantification of Lm localized on the villus surface, in epithelial cells, or in the lamina propria along the z axis of intestinal villi. n = 10 villi from three mice. Pictures are representative of three mice.
Figure 2.
Figure 2.
Ecad is accessible from the luminal side of intestinal villi and is mainly detectable around GCs. (A) Intestinal tissue of iFABP-hEcad transgenic mice was fixed and stained for luminally accessible (acc) hEcad before tissue permeabilization, total hEcad, and nuclei after tissue permeabilization. The image is an optical section of an intestinal villus. Right panels show separated channels and merge of boxed regions, showing accessible hEcad on the apical and lateral sides of cells. (B) Intestinal cells express luminally accessible hEcad. Stack projection of nonpermeabilized intestinal villi stained with WGA and for accessible hEcad and nuclei. The arrow shows a site of luminally accessible hEcad at the villus tip. Right panels show magnification of the boxed region, which shows a GC surrounded by a ring of accessible hEcad at its apical pole. Pictures are representative of three mice. Bars, 10 µm. (C) Schematic representation of an intestinal villus. (D) Quantification of cell subtypes in intestinal villi. GCs, 2.8%; non-GCs, 97.2%. n = 20 villi from two mice. (E) Quantification of cell subtypes expressing luminally accessible hEcad in intestinal villi. n = 20 villi from two mice. (F) Relative proportion of cell types with accessible hEcad. n = 20 villi from two mice. (D–F) Error bars indicate SD.
Figure 3.
Figure 3.
Mucus-expelling GCs exhibit TJ reorganization and delocalization of cell polarity markers and express luminally accessible Ecad. (A) Intestinal tissues were fixed and stained with WGA and for accessible (acc) hEcad and nuclei. Mucus-expelling and mucus-filled GCs expressing luminally accessible hEcad were quantified. Error bars indicate SD. n = 30 villi from three mice. (right) Stack projection of intestinal epithelium showing an accessible hEcad+ GC expelling its mucosal content (arrows; a) and an accessible hEcad GC full of mucus (b). White dashed lines outline the border of GCs. (B) Intestinal tissues were fixed and stained with WGA and for accessible hEcad and TJ proteins (red). (top) Accessible hEcad of a GC (arrows) colocalizes with thickened TJ protein occludin. (bottom) TJ protein ZO-1 is thickened on the apical side of a GC (arrows) with accessible hEcad. (C, top) PAR-3 is depolarized around mucus-expelling GCs (asterisks). (bottom) PKCζ is delocalized from the apical region on mucus-expelling GCs (asterisks). (B and C) Stack projections of whole mount tissues are shown. (D) Intestinal tissues were fixed and stained with WGA and for accessible hEcad, total hEcad, and nuclei. (top) A GC (asterisks) presents an enrichment of total hEcad along its lateral membranes. (bottom) XZ and YZ sections at selected position. Pictures are representative of three mice. Bars, 10 µm.
Figure 4.
Figure 4.
Lm interacts preferentially with GCs at sites where hEcad is luminally accessible and transits toward the lamina propria. (A) The intestinal loop of iFABP-hEcad transgenic mice was infected with 3 × 10⁹ Lm for 40 min. The intestinal tissue was fixed and stained with WGA and for hEcad and nuclei. Optical sections of intestinal mucosa show Lm interacting in and entering an IEC away from (left), next to (middle), and in (right) GCs at sites where hEcad is luminally accessible (top). (middle) Lm in an IEC. (bottom) Lm exits IECs at their basolateral side. Dashed lines indicate basal membrane separating the intestinal epithelium from the lamina propria. Pictures are representative of three mice. Bar, 10 µm. (B) Quantification of cell subtypes per villus. n = 30 villi from three mice. (C) Relative infection per cell type: number of Lm WT (left) and ΔinlA (right) associated with the different cell subtypes expressing or not luminally accessible (acc) hEcad 30 min after infection has been calculated and AGC Lm WT set to 1. n = 12 villi from two mice.
Figure 5.
Figure 5.
Positive correlation between the number of GCs and the efficiency of Lm intestinal invasion and systemic dissemination. IL-33 or PBS alone was administered daily intraperitoneally to iFABP-hEcad transgenic mice for 3 d. Imaging and bacterial inoculation were performed on day 3. (A) Optical section of intestinal villus stained with WGA and for F-actin. Intestinal villi of IL-33–treated mice (bottom) exhibit far more GCs, and GCs secrete far more mucus than PBS-treated control mice (top). (B) Inoculation of intestinal ligated loop were performed on day 3 with 3 × 10⁹ of the indicated strain for 45 min. Panels show optical section of intestinal villus after a ligated loop infection of PBS-treated mouse with Lm WT, IL-33–treated mouse with Lm WT, or IL-33–treated mouse with Lm ΔinlA. Infected intestinal villi were stained for F-actin, nucleus, and Lm (boxes and insets). (A and B) 250-µm vibratome sections are shown. Pictures are representative of two mice. Bars, 10 µm. (C) Quantification of GCs and internalized Lm in intestinal villus of PBS- or IL-33–treated mice after a ligated loop infection of 45 min with 3 × 10⁹ Lm. For each intestinal villus, GCs were enumerated on the larger longitudinal section of observed villi. Error bars indicate SD. n = 20 villi from two mice. (D) Quantification of Lm in the spleen after a ligated loop infection of 45 min in PBS- or IL-33–treated mice on day 3. Horizontal bars indicate the mean. n = 4 mice (**, P < 0.01, as assessed by Student’s t test).
Figure 6.
Figure 6.
Lm translocates through IECs in an InlA-dependent but LLO- and ActA-independent manner. (A) Intestinal loops were infected with 109 of the indicated Listeria strains, and bacteria were quantified in the lamina propria after 30 min. n = 30 villi from three mice. (B) Intestinal loops were infected with the indicated Listeria strains, and bacteria were quantified in the spleen after 30 min of infection. n = 5 mice. (C) Quantification of Lm located in IECs in tissue treated with 10 µg/ml nocodazole, 10 µg/ml colchicine, or their corresponding vehicles (control) for 50 min out of 60 min of Lm infection. n = 11, 15, and 14 infected villi from three mice, respectively. (D) Optical sections of Lm-infected villus treated with PBS as a control, nocodazole, or colchicine for 50 min out of 60 min of Lm infection. Arrows points to Lm either inside epithelial cells or in the lamina propria. (E) Quantification of Lm located in intestinal epithelium or in the lamina propria of tissue treated with PBS (control), 20 µg/ml TAT-NSF700, or 20 µg/ml TAT-NSF scr for 30 min and during Lm infection for 45 min. n = 20 infected villi from three mice. (A–C and E) Error bars indicate SD. (F) Optical sections of intestinal villus treated with PBS as a control, TAT-NSF peptide, or TAT-NSF scr for 30 min and infected with Lm (arrows) in the presence of the peptides for 45 min. (D and F) Tissues are stained for F-actin. Pictures are representative of three mice. (G) TEM sections of PBS-, TAT-NSF700–, or TAT-NSF700scr–treated tissues. Pictures are representative of two mice. Bars: (D and F) 10 µm; (G) 2 µm.
Figure 7.
Figure 7.
Lm-containing vacuole transfer across the intestinal barrier. (A) Intestinal tissue of iFABP-hEcad transgenic mice was infected with 109 Lm for 45 min, fixed, and stained for F-actin, Ecad cytoplasmic domain (cyto dom), and Lm. XZ and YZ show sections at selected positions. (B) Optical sections of infected intestinal villi of mtd Tomato mouse stained for Lm and nuclei and with WGA. (a) Lm (arrowheads) interacting with and entering an enterocyte. (b and c) Lm (arrowheads, insets) inside an enterocyte and associated with membrane (red). (d) Lm (open arrowheads, bottom insets) in the lamina propria and not associated with membrane and another Lm (closed arrowheads, top insets) inside an enterocyte and associated with membrane (red). (C) TEM sections of TAT-NSF–treated and 45-min Lm-inoculated ligated loop. (left) Intracellular Lm located below the cell nucleus and close to the cell membrane (dashed black line) of an IEC. (top right) Higher magnification of main panel. Intracytosolic Lm is located close to the basal cell membrane (dashed black line). (bottom right) Higher magnification of top right panel (boxed area). Intracytosolic Lm is enclosed in a membrane vacuole. Pictures are representative of two mice. Bars: (A and B) 10 µm; (C, left) 5 µm; (C, top right) 2 µm; (C, bottom right) 200 nm.

References

    1. Ameen N.A., Marino C., Salas P.J. 2003. cAMP-dependent exocytosis and vesicle traffic regulate CFTR and fluid transport in rat jejunum in vivo. Am. J. Physiol. Cell Physiol. 284:C429–C438 - PubMed
    1. Appleton P.L., Quyn A.J., Swift S., Näthke I. 2009. Preparation of wholemount mouse intestine for high-resolution three-dimensional imaging using two-photon microscopy. J. Microsc. 234:196–204 10.1111/j.1365-2818.2009.03163.x - DOI - PubMed
    1. Arunachalam B., Phan U.T., Geuze H.J., Cresswell P. 2000. Enzymatic reduction of disulfide bonds in lysosomes: characterization of a gamma-interferon-inducible lysosomal thiol reductase (GILT). Proc. Natl. Acad. Sci. USA. 97:745–750 10.1073/pnas.97.2.745 - DOI - PMC - PubMed
    1. Bacon D.J., Szymanski C.M., Burr D.H., Silver R.P., Alm R.A., Guerry P. 2001. A phase-variable capsule is involved in virulence of Campylobacter jejuni 81-176. Mol. Microbiol. 40:769–777 10.1046/j.1365-2958.2001.02431.x - DOI - PubMed
    1. Baker N.T., Graham L.L. 2010. Campylobacter fetus translocation across Caco-2 cell monolayers. Microb. Pathog. 49:260–272 10.1016/j.micpath.2010.06.008 - DOI - PubMed

Publication types

MeSH terms