Computing gene expression data with a knowledge-based gene clustering approach
- PMID: 21968910
- PMCID: PMC3180043
Computing gene expression data with a knowledge-based gene clustering approach
Abstract
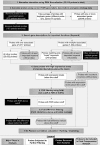
Computational analysis methods for gene expression data gathered in microarray experiments can be used to identify the functions of previously unstudied genes. While obtaining the expression data is not a difficult task, interpreting and extracting the information from the datasets is challenging. In this study, a knowledge-based approach which identifies and saves important functional genes before filtering based on variability and fold change differences was utilized to study light regulation. Two clustering methods were used to cluster the filtered datasets, and clusters containing a key light regulatory gene were located. The common genes to both of these clusters were identified, and the genes in the common cluster were ranked based on their coexpression to the key gene. This process was repeated for 11 key genes in 3 treatment combinations. The initial filtering method reduced the dataset size from 22,814 probes to an average of 1134 genes, and the resulting common cluster lists contained an average of only 14 genes. These common cluster lists scored higher gene enrichment scores than two individual clustering methods. In addition, the filtering method increased the proportion of light responsive genes in the dataset from 1.8% to 15.2%, and the cluster lists increased this proportion to 18.4%. The relatively short length of these common cluster lists compared to gene groups generated through typical clustering methods or coexpression networks narrows the search for novel functional genes while increasing the likelihood that they are biologically relevant.
Figures


Similar articles
-
A cluster merging method for time series microarray with production values.Int J Neural Syst. 2014 Sep;24(6):1450018. doi: 10.1142/S012906571450018X. Epub 2014 Jul 24. Int J Neural Syst. 2014. PMID: 25081426
-
CLEAN: CLustering Enrichment ANalysis.BMC Bioinformatics. 2009 Jul 29;10:234. doi: 10.1186/1471-2105-10-234. BMC Bioinformatics. 2009. PMID: 19640299 Free PMC article.
-
A graph-based approach to systematically reconstruct human transcriptional regulatory modules.Bioinformatics. 2007 Jul 1;23(13):i577-86. doi: 10.1093/bioinformatics/btm227. Bioinformatics. 2007. PMID: 17646346
-
CLIC: clustering analysis of large microarray datasets with individual dimension-based clustering.Nucleic Acids Res. 2010 Jul;38(Web Server issue):W246-53. doi: 10.1093/nar/gkq516. Epub 2010 Jun 6. Nucleic Acids Res. 2010. PMID: 20529873 Free PMC article.
-
Retrospective analysis: reproducibility of interblastomere differences of mRNA expression in 2-cell stage mouse embryos is remarkably poor due to combinatorial mechanisms of blastomere diversification.Mol Hum Reprod. 2018 Jul 1;24(7):388-400. doi: 10.1093/molehr/gay021. Mol Hum Reprod. 2018. PMID: 29746690
Cited by
-
Genomic Clustering of differential DNA methylated regions (epimutations) associated with the epigenetic transgenerational inheritance of disease and phenotypic variation.BMC Genomics. 2016 Jun 1;17:418. doi: 10.1186/s12864-016-2748-5. BMC Genomics. 2016. PMID: 27245821 Free PMC article.
-
Downstream effectors of light- and phytochrome-dependent regulation of hypocotyl elongation in Arabidopsis thaliana.Plant Mol Biol. 2013 Apr;81(6):627-40. doi: 10.1007/s11103-013-0029-0. Epub 2013 Mar 1. Plant Mol Biol. 2013. PMID: 23456246 Free PMC article.
-
Phytochrome-induced SIG2 expression contributes to photoregulation of phytochrome signalling and photomorphogenesis in Arabidopsis thaliana.J Exp Bot. 2013 Dec;64(18):5457-72. doi: 10.1093/jxb/ert308. Epub 2013 Sep 27. J Exp Bot. 2013. PMID: 24078666 Free PMC article.
References
-
- Bellazzi R, Zupan B. Towards knowledge-based gene expression data mining. J Biomed Inform. 2007;40:787–802. - PubMed
-
- Mao L, Mackenzie C, Roh JH, Eraso JM, Kaplan S, Resat H. Combining microarray and genomic data to predict DNA binding motifs. Microbiology. 2005;151:3197–3213. - PubMed
-
- Yu H, Luscombe NM, Qian J, Gerstein M. Genomic analysis of gene expression relationships in transcriptional regulatory networks. Trends Genet. 2003;19:422–427. - PubMed
LinkOut - more resources
Full Text Sources
