. 2012 Mar;15(1):23-32.
doi: 10.1007/s10456-011-9236-y. Epub 2011 Oct 4.

Spatial dependence of alveolar angiogenesis in post-pneumonectomy lung growth

Affiliations

Spatial dependence of alveolar angiogenesis in post-pneumonectomy lung growth

Moritz A Konerding et al. Angiogenesis. 2012 Mar.

Abstract

Growth of the remaining lung after pneumonectomy has been observed in many mammalian species; nonetheless, the pattern and morphology of alveolar angiogenesis during compensatory growth is unknown. Here, we investigated alveolar angiogenesis in a murine model of post-pneumonectomy lung growth. As expected, the volume and weight of the remaining lung returned to near-baseline levels within 21 days of pneumonectomy. The percentage increase in lobar weight was greatest in the cardiac lobe (P < 0.001). Cell cycle flow cytometry demonstrated a peak of lung cell proliferation (12.02 ± 1.48%) 6 days after pneumonectomy. Spatial autocorrelation analysis of the cardiac lobe demonstrated clustering of similar vascular densities (positive autocorrelation) that consistently mapped to subpleural regions of the cardiac lobe. Immunohistochemical staining demonstrated increased cell density and enhanced expression of angiogenesis-related factors VEGFA, and GLUT1 in these subpleural regions. Corrosion casting and scanning electron microscopy 3-6 days after pneumonectomy demonstrated subpleural vessels with angiogenic sprouts. The monopodial sprouts appeared to be randomly oriented along the vessel axis with interbranch distances of 11.4 ± 4.8 μm in the regions of active angiogenesis. Also present within the regions of increased vascular density were frequent "holes" or "pillars" consistent with active intussusceptive angiogenesis. The mean pillar diameter was 4.2 ± 3.8 μm, and the pillars were observed in all regions of active angiogenesis. These findings indicate that the process of alveolar construction involves discrete regions of regenerative growth, particularly in the subpleural regions of the cardiac lobe, characterized by both sprouting and intussusceptive angiogenesis.


Figures
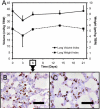
Figure 1
Figure 1
Post-pneumonectomy lung growth. A) After baseline pre- pneumonectomy (day=0), left pneumonectomy was performed. The remaining right lung increased volume (solid line) and dry weight (dashed line)(p<.015). Volume measurements were made by displacement (Scherle) method; weight measurements were made as blood-free weights. Both volume and weight were normalized to total body weight (TBW) to produce lung volume and weight indices. The increase in volume and weight were significant (p<.04;N=8-12 mice per data point; error bars reflect 1 SD). Representative images of Ki-67 (B) and PCNA (C) immunostaining of the lung 6 days after pneumonectomy. Positive nuclear staining (brown) was prominent on day 6 after pneumonectomy (bar = 50 um).
Figure 2
Figure 2
Cell cycle profiling of post-pneumonectomy lung cells obtained by enzymatic digestion and analyzed using flow cytometry (ModFit, Verity Software House). Automated analysis of the ModFit model components, processed by a Marquardt nonlinear least-squares analysis, excluded aggregates (green) and identified S phase and G2 phase lung cells at five time points (Day 0, 3, 6, 14 and 21). A) The combined analysis of the percentage of cells in S+G2 phase of the cell cycle at various time points after pneumonectomy (mean ± 1 SD; 4-5 mice per time point). B) Cell cycle analysis on day 3 after pneumonectomy. Prominent S phase population (cross-hatched; blue arrow) is shown. C) Cell cycle analysis on day 6 after pneumonectomy. Prominent G2 phase population (red arrow) is shown.
Figure 3
Figure 3
Change in right lung lobar weight 21 days after left pneumonectomy. The weight of the right upper lobe (RUL), right middle lobe (RML), right lower lobe (RLL) and cardiac lobe (CL) were measured 21 days after left pneumonectomy and normalized to body weight to provide a lung weight index (LWI). The change in weight of the post-pneumonectomy lobe was compared to normal (gray) and sham thoracotomy (crosshatched) controls. The increase in weight was significant (p<.05; each data point N=8; error bars reflect 1 SD.
Figure 4
Figure 4
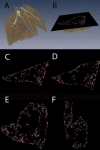
Representative spatial autocorrelation of the post-pneumonectomy lung 6 days after surgery. A) Vascular casting was followed by microCT imaging and 3D image reconstruction. B) Demonstration of the axial image sampling for spatial analysis. C-F) Moran's I spatial autocorrelation of four regions of the cardiac lobe, sampled at an equal spatial interval, are shown. Regions of significant positive autocorrelation are color encoded in a 4 color index: pink>green>white>black.
Figure 5
Figure 5
Immunohistochemistry of angiogenesis-associated growth factors in the cardiac lobe 6 days after pneumonectomy. Increased cell density in subpleural regions was readily recognized in lower resolution analysis of anti-VEGFA (A), and anti-GLUT1 (C) staining. B, D) Higher resolution imaging of the subpleural regions demonstrates active expression of the two angiogenesis-related factors. Bar = 200 um. Note the increased staining intensity in pleural mantle.
Figure 6
Figure 6
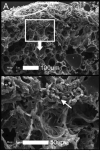
Representative corrosion cast of the post-pneumonectomy lung on day 6 after left pneumonectomy. A) Variable caliber pleural vessels (ellipse) associated with increased vascular density was noted in subpleural regions of the lung (square). B) Higher resolution imaging demonstrated increased vascular density (arrow).
Figure 7
Figure 7
Mechanism of post-pneumonectomy angiogenesis. Regions of active angiogenesis post-pneumonectomy (days 3-6) were demonstrated by corrosion casting of the pulmonary vasculature and imaging by SEM. A-C) Numerous angiogenic sprouts (e.g. circles) were noted at 10-15um interbranch distances. Spatially coincident with the sprouts were holes in the casts (e.g. arrows) consistent with intussusceptive pillars. D) Casts of the alveoli on day 9 after pneumonectomy demonstrated a double layer capillary morphology (arrow).

References

    1. Addis T. Compensatory hypertrophy of the lung after unilateral pneumectomy. J. Exp. Med. 1928;47:51–56. - PMC - PubMed
    1. Tatar-Kiss S, Bardocz S, Kertai P. Changes in L-ornithine decarboxylase activity in regenerating lung lobes. FEBS Lett. 1984;175:131–134. - PubMed
    1. Heuer GJ, Dunn GR. Experimental pneumectomy. Bull Johns Hopkins Hosp. 1920;31:31–42.
    1. Bremer JL. The fate of the remaining lung tissue after lobectomy or pneumonectomy. J.Thorac.Surg. 1936;6:336–343.
    1. Sery Z, Keprt E, Obrucnik M. Morphometric analysis of late adaptation of residual lung following pneumonectomy in young and adult rabbits. J. Thorac. Cardiovasc. Surg. 1969;57:549–557. - PubMed

Publication types