Review
. 2011 Dec;63(4):901-37.
doi: 10.1124/pr.110.003350.

The significance of G protein-coupled receptor crystallography for drug discovery

Affiliations
Review

The significance of G protein-coupled receptor crystallography for drug discovery

John A Salon et al. Pharmacol Rev. 2011 Dec.

Abstract

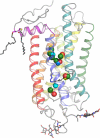
Crucial as molecular sensors for many vital physiological processes, seven-transmembrane domain G protein-coupled receptors (GPCRs) comprise the largest family of proteins targeted by drug discovery. Together with structures of the prototypical GPCR rhodopsin, solved structures of other liganded GPCRs promise to provide insights into the structural basis of the superfamily's biochemical functions and assist in the development of new therapeutic modalities and drugs. One of the greatest technical and theoretical challenges to elucidating and exploiting structure-function relationships in these systems is the emerging concept of GPCR conformational flexibility and its cause-effect relationship for receptor-receptor and receptor-effector interactions. Such conformational changes can be subtle and triggered by relatively small binding energy effects, leading to full or partial efficacy in the activation or inactivation of the receptor system at large. Pharmacological dogma generally dictates that these changes manifest themselves through kinetic modulation of the receptor's G protein partners. Atomic resolution information derived from increasingly available receptor structures provides an entrée to the understanding of these events and practically applying it to drug design. Supported by structure-activity relationship information arising from empirical screening, a unified structural model of GPCR activation/inactivation promises to both accelerate drug discovery in this field and improve our fundamental understanding of structure-based drug design in general. This review discusses fundamental problems that persist in drug design and GPCR structural determination.


Figures

Fig. 1.
Fig. 1.
GPCR structure-function. A, principal hallmarks of GPCR structure include a serpentine transmembrane topology compsed of seven α-helical hydrophobic stretches interspersed by intra-and extracellular loops of indeterminate structure. This results in the presentation of an extracellular amino and cytoplasmic carboxyl terminus. The N terminus and extracellular loops can be glycosylated to varying degrees, and extracellular loops 1 and 2 are connected via a disulfide linkage, required for stability and function of the receptor. The C-terminal tail is anchored to the intracellular face of the lipid bilayer via palmitoylation to produce a short intracellular loop, which typically forms an α-helical structure. These receptors also display a series of conserved amino acid motifs thought to be involved in a rearrangement of receptor domains during ligand activated signal transduction. These include three conserved motifs that provide prominent micro-switches: 1) H-III's D(E)RY motif; Arg135 when unlocked from Glu247 interacts with H-V's Tyr223 to release constraints holding the receptor in the inactive state. 2) H-VI's CWxP motif; Trp265 undergoes rotamer isomerization needed for receptor activation. 3) H-VII's NPxxYx(5,6)F motif; Tyr306 undergoes rotamer isomerization during activation and Asn302 participates in an intrahelical H-bond network. Pro residues within H-V (Pro215), H-VI (Pro267), and H-VII (Pro303) are highly conserved and believed to form a staircase of transmembrane kinks required for the increase in rotational dynamics of these helices during activation. Rotation of these transmembrane helices brings disparate segments of intracellular loops in and out of proximity to the G protein complex causing its GTP-driven dissociation and subsequent regulation of various cellular effector cascades, the overall effect being an amplification of the original activating signal. B, the size and complexity of GPCR pharmacophores varies greatly, ranging upward from free atoms/ions to small molecules, small peptides, unmasked intrareceptor amino acid stretches, and even large glycoprotein hormones. Some correlation between receptor sequence and ligand class can be generated, which may reflect ligand-receptor recognition, but the range of sizes and diversity of ligand structures make it difficult to determine molecular mechanisms underlying ligand-receptor activation.
Fig. 2.
Fig. 2.
The GPCR signalosome: components and actions. The molecular components of GPCR signaling pathways interact to generate multiple effects and types of regulation. The full complement of endogenous ligands is currently unknown, and the structural nature of binding sites within the receptor is surprisingly varied, including conserved orthosteric sites and other sites such as nonconserved isolated ectopic and adjacent bitopic sites as well as remote allosteric sites that regulate the affinity of the activating sites. The size of the “druggable” GPCR genome currently stands at ∼750 but could increase as with the addition of taste and odorant receptors. Dimerization or oligomerization of GPCRs, with themselves or with other entities, provides additional specificity and complexity of pharmacological responses. The interaction of activated GPCRs with the G protein complex is influenced by both the ligand-defined stabilized receptor structure and the nucleotide-bound α-subunit of the G protein heterotrimer. Dependent upon the specific G protein in the complex, activation will result in one or more of four initial events, including cAMP production, cAMP reduction, intracellular Ca2+ mobilization, or regulation of proton flux. These cellular effects (both proximal and integrated) can occur partially or fully, can be positive or negative, and can be affected by positive or negative allosteric modulators. The large number of possible permutations provides some insight into the increasingly complex pharmacology exhibited by this superfamily.
Fig. 3.
Fig. 3.
The drug discovery and development pipeline. To be therapeutically effective, a drug must be present in an adequate concentration at its site(s) of action within the body. In addition, the molecule must be safe—that is, eliminated unchanged or as a metabolite from the body without causing injury. The discovery and development “pipeline” is designed to obtain compounds conforming to these requirements. The earliest stages involving identification of linkage between a target and various disease states draws upon basic research conducted in the academic (gray) and pharmaceutical (blue) sectors. Hypotheses are validated as the concept enters the lead discovery phase of the pharmaceutical process. Upon validation, the preclinical work of finding molecules that specifically modulate a target and possess suitable pharmacokinetic, pharmacodynamic and toxicological profiles ensues. If such molecules are identified, formulation and manufacturing parameters are determined to prepare for clinical trials in human subjects. Once validation is achieved and a campaign is launched, the discovery process can take an additional 3 to 6 years before a compound enters the clinic or is terminated. The onset of clinical trials is heralded by submission to the FDA of an investigational new drug proposal (IND) that includes detailed protocols for the trials and criteria for success. Once accepted, phase I trials are initiated to establish safety in healthy human subjects. Upon successful completion of phase I trials, phase II ensues to establish the drug candidate's efficacy for treatment of its chosen disease and to assess its side effects, which together help establish an effective and safe dosage regimen. Phase III is an extension of phase II that involves a larger patient and control set to establish statistically significant safety and efficacy over time. If the results from phase III appear favorable, a new drug application (NDA) is filed with and reviewed by the FDA along with protocols and preparations for large-scale manufacturing, product launch, and long-term monitoring of the patient population (phase IV). Clinical trials are the most resource-intensive and typically take 6 to 7 years before a new drug reaches final review.
Fig. 4.
Fig. 4.
Attrition and costs. Idealized description of a typical HTS-driven small-molecule drug discovery campaign. Once validated, the target is enabled for HTS and subsequent profiling as part of the lead discovery process. The largest number of compounds is processed initially through single- or multitiered screens of libraries containing approximately a million separate chemical entities. Primary hits emerging from screening are then confirmed and characterized as they engage in hit-to-lead evolution, during which several thousand new analogs can be generated. The medicinal chemistry process continues on a refined number of advanced leads throughout the preclinical workup as modifications are made to achieve acceptable ADME, PD, and toxicological properties. Typically, projects seek to have several candidate compounds available (both primary and backup compounds) upon initiation of clinical trials, because the prospect of unforeseen liabilities remains throughout the remainder of the process. Costs for any one successful project can exceed one billion dollars. When one factors in the broader project failure rate encompassing all phases of the drug discovery pipeline, the costs and compound attrition are further amplified. Thus, there is considerable pressure to critically evaluate projects at all stages of discovery/development and, if warranted, terminate the process as early as possible.
Fig. 5.
Fig. 5.
Evolution of pharmacological complexity. Kinetic models of GPCR action have evolved from simple two-state models reflecting classic mass-driven chemical equilibrium principles (a) to more complex cubic ternary complexes (Weiss et al., 1996a,b,c; Hall, 2000) (b) that incorporate G protein interactions with both active and inactive receptor isomers and finally to a quaternary complex of GPCR allosterism (Christopoulos and Kenakin, 2002) (c), which includes an additional modulatory ligand that can cooperatively affect the binding of the orthosteric ligand and the subsequent functional interaction of the receptor with its preferred G protein partner. Principle kinetic constants (L, Kx) for each transition pair with various cooperativity factors (α, β, γ, δ, ε, ζ, η, θ, ι, κ, λ,…) describe particular steps. Discovery of additional biochemical phenomena such as receptor homo-/heterodimerization and the possibility that a given receptor can interact with multiple G protein partners suggests that even these extended allosteric models are insufficient to fully describe the behavior of GPCRs.
Fig. 6.
Fig. 6.
Observed and calculated dimeric/oligomeric structures implicate various interfaces in GPCR structures. A, dimer observed in photoactivated rhodopsin structure (PDB IDs 2I37 and 2I36). This dimer interface relies primarily on contacts involving H-I and H-8. Opsin-derived structures also contain a very similar dimer interface as a crystal contact (PDB IDs 3CAP, 3DQB, 3PXO, 3PQR). A similar contact was also calculated to build up rows of parallel dimers observed in situ by AFM imaging. B, dimer observed in squid rhodopsin (PDB ID 2Z73). Contacts along H-IV and H-V are responsible for dimerization. C, crystallographic dimer observed in one of the β2-adrenergic receptor structures (PDB ID 3D4S). Contacts with cholesterol as well as with H-I form the basis of this dimeric contact. D and E, on the basis of biochemical results and AFM images of intact native murine rod outer segment membranes, a model (PDB ID 1N3M) was proposed that involves contacts along H-IV and H-V (D) as well as contacts along H-I (similar to A). An additional contact (E) using contacts between H-V and H-VI on one monomer contacts H-I and H-IV on the adjacent monomer. F, the dimer observed in several CXCR4 structures (PDB ID 3ODU) relies upon contacts along H-IV and H-V. The small diagram below each dimer shows the approximate positions of the ends of each helix on the intracellular face of each dimer. Helices are colored according as follows: H-I, red; H-II, orange; H-III, yellow; H-IV, lime green; H-V, dark green; H-VI, teal; H-VII, blue; and H-8, purple.
Fig. 7.
Fig. 7.
Therapeutic modalities. Drug molecules can be broadly categorized as either small molecules or biologics, with development and FDA review after new chemical entity and biologic license application guidelines, respectively. Although GPCR drug discovery has historically been dominated by small molecule programs, this predominance is changing in part because of the increasing awareness that target receptors can have much larger endogenous ligands (e.g., glycohormones, viral entry proteins) and in part because of methods that merge antibody or other scaffolds with chemical and peptide moieties to provide robust delivery vehicles for active small molecule warheads. An application of this method is the newly developed “avimer” technologies, which are antibody mimetics that present multiple binding epitopes. SBDD methods and infrastructure benefit from both modalities by identifying novel sites accessible to small-molecule binding and providing purified GPCR proteins stabilized in specific conformations to capture large molecule drug candidates through more empiric screening methods.
Fig. 8.
Fig. 8.
Information flow during rhodopsin activation. Upon absorption of a photon of light, the 11-cis-retinylidene chromophore is isomerized to its all-trans-state, driving all subsequent activation steps. Deprotonation of the Schiff base linkage follows photoisomerization, and through small-scale changes within the transmembrane region, the activation signal is propagated to the D(E)RY (Glu134, Arg135, and Tyr136) region, resulting in disruption of the “ionic lock” and uptake of a proton from the cytoplasm (most likely onto Glu181, which protrudes toward the chromophore from the one of the β-strands of the plug domain), leading to fully activated meta II rhodopsin. Meta ll catalyzes nucleotide exchange upon the G protein α-subunit of transducin heterotrimers, propagating the activation signal inside the cell. Three regions important in activation and other GPCR functions are highlighted within the transmembrane region: the D(E)RY motif, the NPxxYx(5,6)F motif. and the chromophore-binding site. The three insets detail the interactions present within these conserved motifs. For ease of interpretation, helices are depicted in the following colors: H-I, red; H-II, orange; H-III, yellow; H-IV, lime green; H-V, dark green; H-VI, teal; H-VII, blue; and H-8, purple.
Fig. 9.
Fig. 9.
Homology of water-binding sites within the transmembrane region of GPCRs. Although overall sequence similarity, with the exception of globally conserved GPCR motifs, is low within the transmembrane region, comparison of the positions of crystallographically observed (ordered) water molecules reveals several clusters of solvent in similar positions. These similarities and the conservation of amino acid side chains that interact with these waters suggest a functional role for these water molecules. Water molecules from rhodopsin (PDB ID 1U19) are depicted in red, β2-adrenergic receptor (PDB ID 2RH1) in green, A2A-adenosine receptor (PDB ID 3EML) in yellow, β1-adrenergic receptor (PDB ID 2VT4) in blue, and CXCR4 (PDB ID 3ODU) in cyan.
Fig. 10.
Fig. 10.
Ligand-binding sites within selected GPCR structures. For these sites, all polar contacts within 3.4 Å of each other are indicated by brown dashed lines and nonpolar side chains are also shown when they do not obscure the ligand. In some cases, portions of the transmembrane helices are removed for clarity. A, chromophore of rhodopsin (PDB ID 1U19) is a tethered ligand (through a Schiff-base linkage); the only polar contact in the inactive state is to the counter ion, Glu113. B, binding of the inverse agonist carazolol to the β2-adrenergic receptor (PDB ID 2RH1). C, antagonist cyanopindolol bound to the β1-adrenergic receptor (PDB ID 2VT4). D, binding of the A2a-adenosine receptor (PDB ID 3EML) to the antagonist ZM241385 implicates both solvent mediated interactions as well as direct interactions with amino acid side chains in ligand binding. E, structure of CXCR4 bound to the antagonist It1t (PDB ID 3ODU) uses both solvent and direct interactions to define the ligand-binding pocket. F, D3 dopamine receptor (PDB ID 3PBL) bound to the antagonist eticlopride.
Fig. 11.
Fig. 11.
Structural coverage along the continuum of states that comprise the activation of rhodopsin. The structural plasticity necessary for transmission of the activation signal from receptor to G protein is evident even in the ground state structures of rhodopsin; although all three groups of structures are grossly similar, each structure captures distinctly different conformers of the opsin backbone although each is spectroscopically identical and each exhibits little to no activity toward G protein. Although slight differences are scattered throughout the structure, the major differences observed are in the third cytoplasmic loop (C-III), the loop connecting H-V and H-VI, the ends of which are proposed to undergo structural rearrangement upon activation. The early photointermediate structures (denoted in pink), which are spectroscopically distinct from both ground state and later photointermediates superpose well with only the PDB ID 1U19 (P41) structures, again with major differences observed only in the C-III loop compared with PDB IDs 2I35/2I36 (P3112) or PDB IDs 3C9L/1GZM (P64) structures. The structure of PDB ID 2I37 (which was the first crystal structure to exhibit the characteristic absorbance at 360 nm indicative of deprotonation of the Schiff base linking the chromophore to Lys296, a hallmark of attaining the activated state) demonstrated only small- to medium-scale shifts in structure that were confined to the C-II and C-III loops, rather than the large-scale rigid body movements proposed by earlier studies. The observed structural changes could best be explained as being due to a loss of constraint within the transmembrane region, resulting in altered protein backbone dynamics. Because ground state crystals in the same unit cell and space group (PDB ID 2I36) were available, the direct comparison with photoactivated rhodopsin (PDB ID 2I37) revealed structural changes that accompanied photoactivation apart from structural changes due to differences in crystallization conditions/unit cell contacts. These crystals were capable of returning to the ground state upon storage in the dark but were incapable of surviving treatment with hydroxylamine to remove chromophore. From the other end of the spectrum, the Ernst group has to great success used the phototransduction cascade end product, opsin, as a structural target and starting point for probing the activation of rhodopsin. The initial crystal structure of opsin (PDB ID 3CAP) and a following structure opsin with a peptide derived from the C terminus of the α subunit of transducin (Gt) (PDB ID 3DQB), although mostly colorless, contain density within the chromophore active site that may correspond to precipitant, buffer, detergent, or hydrolyzed chromophore when composite omit maps are calculated from the deposited data, which was fortuitous as the instability of opsin state in the detergent solubilized state would further complicate crystallization. The PDB ID 3CAP and PDB ID 3DQB structures both exhibited larger movements of H-V and H-VI (and the connecting C-III loop) than observed in the PDB ID 2I37 structure. The structure of opsin in the Gt peptide bound structure was postulated by the authors to be the conformation of opsin in its G protein-interacting state. By treating these very same crystals with all-trans-retinal (PDB IDs 3PXO and 3PQR), the authors were able to obtain crystals that were spectrally indistinguishable from the PDB ID 2I37 crystals. Standfuss et al. (2011) were also able obtain an additional crystal form of photoactivated rhodopsin from heterologously expressed, constitutively active opsin “regenerated” with all-trans-retinal (PDB ID 2X72). All of the opsin derived structures are identical (with the exception of the observed chromophore) within the precision of structures determined at this resolution (RMSD ≈ 0.4 Å). These crystals were incapable of being pushed to the ground state by reconstitution with 11-cis-retinal. Recent solid-state NMR studies suggest the existence of multiple conformational states after photoactivation with only a subset competent to transduce the signal to G protein (Struts et al., 2011). These multiple activated states (highlighted with a blue-gray box in the figure) underlie a fundamental structural disconnect between the two groups of activated state structures. It will only be through direct structural observation of the complex or complexes between rhodopsin and Gt that the precise nature of the interactions between activated rhodopsin and G protein will be observed.
Fig. 12.
Fig. 12.
Return on investment. Output of new chemical entities (NCE) has declined over a 10-year period despite an increase in overall R&D spending and a steady average development time for those drugs that eventually prove successful. Factors contributing to this problem involve increased governmental regulatory requirements such as the (now) larger patient pools needed to satisfy FDA standards. More fundamental issues are also likely involved, including the increasing complexity of diseases targeted and the associated slowing of target validation as well as the departure from conventional mechanisms of action and the incomplete coverage of chemical space in our current screening libraries.

References

    1. Abola E, Kuhn P, Earnest T, Stevens RC. (2000) Automation of X-ray crystallography. Nat Struct Biol 7:973–977 - PubMed
    1. Adams PD, Grosse-Kunstleve RW. (2000) Recent developments in software for the automation of crystallographic macromolecular structure determination. Curr Opin Struct Biol 10:564–568 - PubMed
    1. Alewijnse AE, Timmerman H, Jacobs EH, Smit MJ, Roovers E, Cotecchia S, Leurs R. (2000) The effect of mutations in the DRY motif on the constitutive activity and structural instability of the histamine H(2) receptor. Mol Pharmacol 57:890–898 - PubMed
    1. Altenbach C, Kusnetzow AK, Ernst OP, Hofmann KP, Hubbell WL. (2008) High-resolution distance mapping in rhodopsin reveals the pattern of helix movement due to activation. Proc Natl Acad Sci USA 105:7439–7444 - PMC - PubMed
    1. Alves ID, Salamon Z, Hruby VJ, Tollin G. (2005) Ligand modulation of lateral segregation of a G-protein-coupled receptor into lipid microdomains in sphingomyelin/phosphatidylcholine solid-supported bilayers. Biochemistry 44:9168–9178 - PMC - PubMed

Publication types

MeSH terms

Substances

LinkOut - more resources