. 2011 Oct 11;108(41):16980-5.
doi: 10.1073/pnas.1106999108. Epub 2011 Oct 3.

Allosteric vs. spontaneous exit-site (E-site) tRNA dissociation early in protein synthesis

Affiliations

Allosteric vs. spontaneous exit-site (E-site) tRNA dissociation early in protein synthesis

Chunlai Chen et al. Proc Natl Acad Sci U S A. .

Abstract

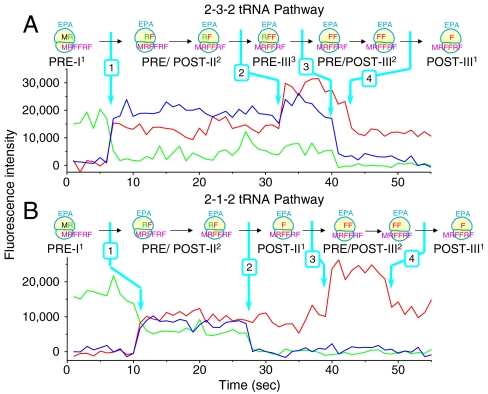
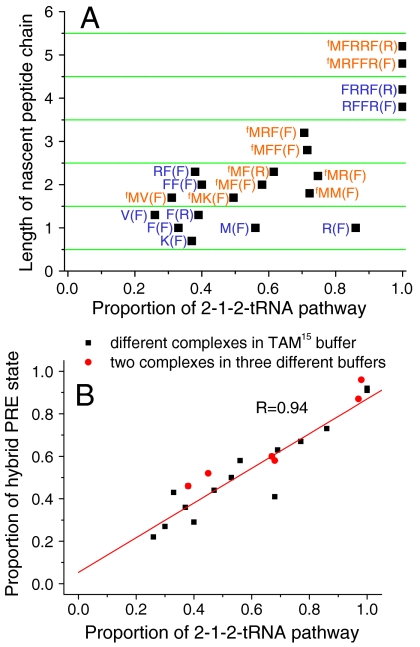
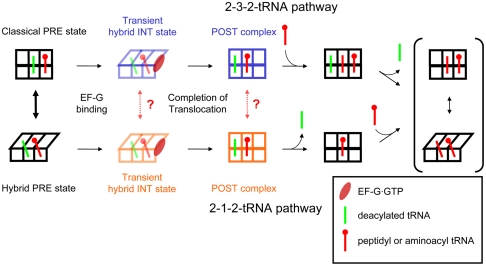
During protein synthesis, deacylated transfer RNAs leave the ribosome via an exit (E) site after mRNA translocation. How the ribosome regulates tRNA dissociation and whether functional linkages between the aminoacyl (A) and E sites modulate the dynamics of protein synthesis have long been debated. Using single molecule fluorescence resonance energy transfer experiments, we find that, during early cycles of protein elongation, tRNAs are often held in the E site until being allosterically released when the next aminoacyl tRNA binds to the A site. This process is regulated by the length and sequence of the nascent peptide and by the conformational state, detected by tRNA proximity, prior to translocation. In later cycles, E-site tRNA dissociates spontaneously. Our results suggest that the distribution of pretranslocation tRNA states and posttranslocation pathways are correlated within each elongation cycle via communication between distant subdomains in the ribosome, but that this correlation between elongation cycle intermediates does not persist into succeeding cycles.


Conflict of interest statement

Conflict of interest statement: B.S.C. and Y.E.G. are paid consultants of Anima Cell Metrology, Inc.

Figures

Fig. 1.
Fig. 1.
Two representative single molecule fluorescence traces. (A) The 2-3-2-tRNA pathway and (B) 2-1-2-tRNA pathway. Initiation complexes (ICs) programmed by mRNA MRFFRFYRF (Table S1; single letter amino acid code) were premixed with Arg-tRNAArg(Cy3) TC. The resulting PRE-I1 complex (in which PRE, I, and 1 indicate pretranslocation complex, first translation cycle after formation of the IC, and presence of one labeled tRNA, respectively) was immobilized on a glass cover slip. ALEX fluorescence traces were collected after injecting 10 nM Phe-tRNAPhe(Cy5) TC, 2 μM EF-G and 2 mM GTP to complete the first three elongation cycles (Table S2). Traces were collected at 24 °C. Cy3 fluorescence (green) and sensitized emission of Cy5 (FRET; blue) under 532 nm excitation, alternating with Cy5 fluorescence (red) under 640 nm excitation, were collected and displayed. The TC binding rate constants (8–10 × 106 M-1 s-1) measured here are consistent with in vitro ensemble experiment measurements [5–15 s-1 at 1–10 μM TC (28, 29)]. Formation of different complexes due to tRNA association or dissociation, indicated by changes of Cy3 and Cy5 fluorescence intensity, are marked by arrows. As the contributions of photobleaching to Cy3 and Cy5 disappearance are 0.56% and 1.6%, respectively (Fig. S1), the disappearance of Cy3 and Cy5 fluorescence is due almost entirely to dissociation of labeled tRNAs from the ribosome.
Fig. 2.
Fig. 2.
A multiple turnover trace, in which the ribosome follows the 2-3-2 pathway in Cycle II and the 2-1-2 pathway in Cycles III and IV. ICs were premixed with Arg-tRNAArg(Cy3) TC, and the resulting PRE-I1 complex was translated up to the fifth elongation cycle by adding 10 nM Arg-tRNAArg(Cy3) TC, 10 nM Phe-tRNAPhe(Cy5) TC, 2 μM EF-G and 2 mM GTP. For traces displaying all five expected labeled tRNA binding events, the 2-3-2-tRNA and 2-1-2-tRNA pathways are seen 42% and 58% of the time, respectively, in Cycle II. In contrast, only the 2-1-2-tRNA pathway is observed for Cycles III and IV. Conditions as in Fig. 1.
Fig. 3.
Fig. 3.
Two representative single molecule translation traces initiated from preformed PRE-II2 complexes with mRNA fMRFFRFYRF (A and B) recorded at 100 ms integration time per frame with ALEX between 532 nm and 640 nm lasers. POST-II2 complexes translocated from the classical PRE state (A; high FRET before EF-G·GTP injection) and from the hybrid PRE state (B, low FRET before EF-G·GTP injection) go through 2-3-2 (A) and 2-1-2 pathways (B), respectively. Translocation, tRNA association and dissociation, indicated by changes of Cy3 and Cy5 fluorescence intensities, are marked by arrows. In A, the exact time following EF-G·GTP and TC addition at which the classical PRE-II2 complex translocates to POST-II2 complex (period marked by a cyan block) is not clear because these states have similar FRET values (classical PRE, 0.6; hybrid PRE, 0.3; POST, 0.55), so that transition is indicated by a dashed arrow. The traces were smoothed by applying a three-frame moving average. Experimental conditions as in Fig. 1. (C and D) FRET distributions of PRE-II2 states of the ribosomes that ultimately went through either the 2-3-2-tRNA pathway or the 2-1-2-tRNA pathway, respectively. Assignments of stable and fluctuating complexes were based on the transition between classical and hybrid PRE states before EF-G·GTP injection. For the fluctuating complexes, FRET values from the last second before EF-G·GTP injection were used. The solid fitted lines are Gaussian distributions and the dashed lines are the sums of two Gaussian components. The component with high FRET efficiency (0.6) is assigned as the classical state and the component with lower FRET (0.3) is assigned to the hybrid state (17, 30).
Fig. 4.
Fig. 4.
Dependence of various parameters on the concentration of Phe-tRNAPhe(Cy5) TC for ribosomes programmed with mRNA fMRFFRFYRF and initiated with either uncharged tRNAfMet or with charged fMet-tRNAfMet as indicated. (A) Overall lifetime for E-site tRNA occupancy within POST-II2 complexes going through either the 2-3-2 pathway [black squares, measured between arrows (1) and (3), as in Fig. 1A] or 2-1-2 pathway [red circles, measured between arrows (1) and (2), as in Fig. 1B]. (B) Association rate constant of Phe-tRNAPhe(Cy5) TC paired with the 4th codon [Phe; red (2-1-2 pathway) and black (2-3-2 pathway) open squares] and dissociation rate constant of the E-site tRNAArg(Cy3) paired with the 2nd codon [Arg; red (2-1-2 pathway) and black (2-3-2 pathway) filled circles]. For the 2-3-2 pathway, rate constants for TC binding and E-site dissociation after the A site becomes occupied are measured as the reciprocals of the times between arrows (1) and (2), and (2) and (3), respectively (traces as in Fig. 1A). For the 2-1-2 pathway, rate constants for E-site dissociation and TC binding after the E site becomes empty are measured as the reciprocals of the times between arrows (1) and (2), and (2) and (3), respectively (traces as in Fig. 1B). The intervals between arrows (1) and (2) in Fig 1 A and B are dominated by the rates of TC binding or E-site dissociation, respectively, because accommodation and translocation are considerably faster (SI Text, Translocation Rate Constants at Elongation Cycles II, III, and IV). Errors bars in A and C indicate SD. The red circles in A and C are the same data plotted as reciprocals for comparison; in A the SD values are within the size of the symbols. (C) Fraction of the 2-1-2 tRNA pathway of POST-II2 complexes for ribosomes initiated with either 74% (red circles) or 0% (black squares) fMet-charged initiator tRNAfMet. The blue lines are theoretical predictions based on the assumption that the 2-1-2 vs. 2-3-2 tRNA pathway of the POST complex is determined by a competition between stochastic reactions TC association and E-site tRNA dissociation.
Fig. 5.
Fig. 5.
(A) Distribution of translation pathways is affected by the length and sequence of the nascent peptide chain. Letter(s) before parentheses indicate the amino acid sequence of the nascent chain bound to the ribosome in the POST complex and the letter within parentheses is the next cognate aa-tRNA. M and fM represent elongator Met and initiator fMet, respectively. The values for complexes without fMet (blue sequences) are measured from the ribosomes initiated with uncharged tRNAfMet. The 2-1-2 pathway values for complexes with N-terminal fMet (red sequences) are linearly extrapolated from the results of ribosomes initiated from uncharged and highly charged (89% or 80%) tRNAfMet, as explained in Figs. S5 and S6. B. Correlation between the proportion of ribosomes in the hybrid PRE state and subsequent 2-1-2-tRNA pathway selection. Black squares: various complexes measured in TAM15 buffer and shown in Fig. 5A and Fig. S4, Red diamonds: two of the complexes were measured in TAM15 buffer and also in buffers B and C (see also Table S3). The proportions of hybrid PRE state were measured from FRET between tRNAs in the P and A sites within preformed immobilized PRE complexes. Both fluctuating and stable PRE complexes were counted into the FRET distributions (17).
Fig. 6.
Fig. 6.
The initial mode of elongation. In the first few elongation cycles, elongation proceeds via both 2-3-2-tRNA and 2-1-2-tRNA pathways. Within many PRE complexes, the classical and hybrid tRNA states can reversibly interconvert. The transient INT states and POST complexes arising from EF-G·GTP facilitated translocation of classical and hybrid PRE complexes, however, are conformationally distinct and do not freely interconvert (dashed arrows), thereby retaining conformational memory throughout an elongation cycle.

References

    1. Schmeing TM, Ramakrishnan V. What recent ribosome structures have revealed about the mechanism of translation. Nature. 2009;461:1234–1242. - PubMed
    1. Ramakrishnan V. Ribosome structure and the mechanism of translation. Cell. 2002;108:557–572. - PubMed
    1. Simonetti A, et al. A structural view of translation initiation in bacteria. Cell Mol Life Sci. 2009;66:423–436. - PMC - PubMed
    1. Mitra K, Frank J. Ribosome dynamics: Insights from atomic structure modeling into cryo-electron microscopy maps. Annu Rev Biophys Biomol Struct. 2006;35:299–317. - PubMed
    1. Moazed D, Noller HF. Intermediate states in the movement of transfer-RNA in the ribosome. Nature. 1989;342:142–148. - PubMed

Publication types