. 2011 Oct 11;108(41):17123-8.
doi: 10.1073/pnas.1111245108. Epub 2011 Oct 3.

Full p53 transcriptional activation potential is dispensable for tumor suppression in diverse lineages

Affiliations

Full p53 transcriptional activation potential is dispensable for tumor suppression in diverse lineages

Dadi Jiang et al. Proc Natl Acad Sci U S A. .

Abstract

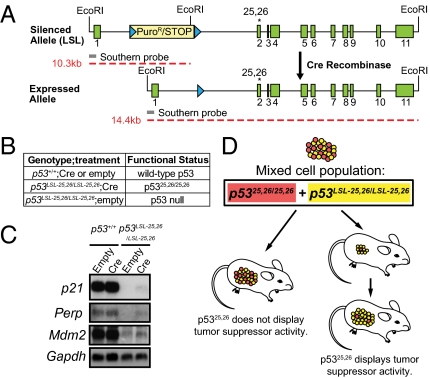
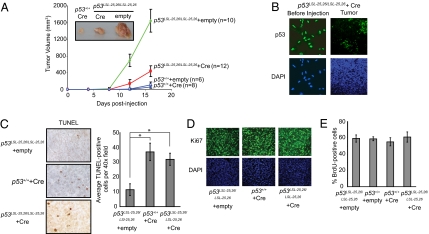
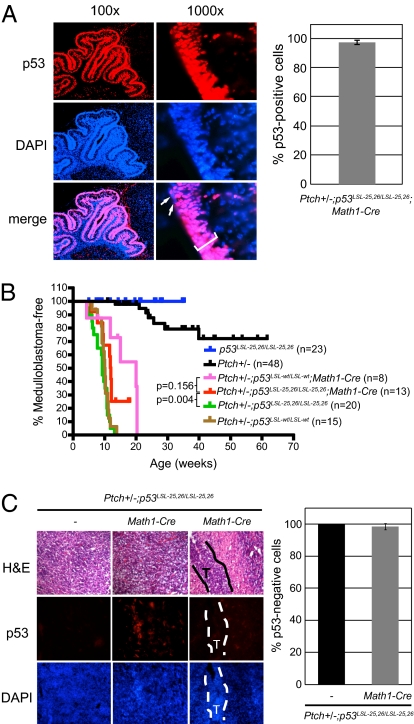
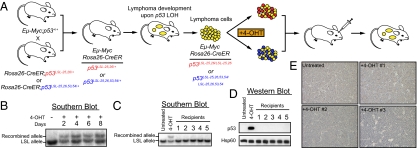
Over half of all human cancers, of a wide variety of types, sustain mutations in the p53 tumor suppressor gene. Although p53 limits tumorigenesis through the induction of apoptosis or cell cycle arrest, its molecular mechanism of action in tumor suppression has been elusive. The best-characterized p53 activity in vitro is as a transcriptional activator, but the identification of numerous additional p53 biochemical activities in vitro has made it unclear which mechanism accounts for tumor suppression. Here, we assess the importance of transcriptional activation for p53 tumor suppression function in vivo in several tissues, using a knock-in mouse strain expressing a p53 mutant compromised for transcriptional activation, p53(25,26). p53(25,26) is severely impaired for the transactivation of numerous classical p53 target genes, including p21, Noxa, and Puma, but it retains the ability to activate a small subset of p53 target genes, including Bax. Surprisingly, p53(25,26) can nonetheless suppress tumor growth in cancers derived from the epithelial, mesenchymal, central nervous system, and lymphoid lineages. Therefore, full transactivation of most p53 target genes is dispensable for p53 tumor suppressor function in a range of tissue types. In contrast, a transcriptional activation mutant that is completely defective for transactivation, p53(25,26,53,54), fails to suppress tumor development. These findings demonstrate that transcriptional activation is indeed broadly critical for p53 tumor suppressor function, although this requirement reflects the limited transcriptional activity observed with p53(25,26) rather than robust transactivation of a full complement of p53 target genes.


Conflict of interest statement

The authors declare no conflict of interest.

Figures

Fig. 1.
Fig. 1.
Experimental design for this study. (A) Schematic of the p5325,26 allele. The silenced LSL allele comprises exons 1–11 (green boxes) of p53 with the L25Q/W26S mutations in exon 2 (asterisk) and a transcriptional stop element/puromycin resistance cassette (yellow box) flanked by LoxP sites (blue triangles) inserted into intron 1. The transcription of mutant p53 is silenced until Cre mediates recombination between the LoxP sites and excision of the stop element. The location of the 5′ probe (gray bar) used for Southern blotting and the sizes of the EcoRI fragments (red dashed lines) generated from each allele are indicated. (B) Table summarizing conditional p53 protein expression strategies used throughout the manuscript. (C) Analysis of p53 target gene expression in E1A-Ras MEFs by Northern blotting. Gapdh serves as a loading control. Efficient adenoviral-Cre–mediated recombination of the LSL-25,26 allele was confirmed by immunofluorescence staining for p53, with over 94% of the cells expressing p5325,26. (D) An in vivo competition assay was used throughout the study to evaluate the tumor suppression potential of p5325,26. Red cells represent p5325,26 mutant-expressing tumor cells, and yellow ones represent tumor cells in which Cre failed to delete the LSL element, and therefore retain the p53LSL-25,26/LSL-25,26 status and are p53 null. If tumors form from p5325,26 mutant cells (Left), then the mutant is ineffective as a tumor suppressor. If tumors form due to the outgrowth of the p53 null cells (Right), then it suggests that the p5325,26 mutant is an effective tumor suppressor. In this case, tumor growth may appear retarded at early time points relative to p53 null tumors.
Fig. 2.
Fig. 2.
p5325,26 efficiently suppresses tumorigenesis in transplanted transformed MEF fibrosarcomas through the induction of apoptosis. (A) p5325,26 restricts tumor growth. In this and subsequent panels of this figure, MEFs expressed E1A, H-RasV12, and no p53 (p53LSL-25,26/LSL-25,26 + Ad-empty), p53wt (p53+/+ + Ad-empty or p53+/+ + Ad-Cre), or p5325,26 (p53LSL-25,26/LSL-25,26 + Ad-Cre). E1A-Ras MEFs of various p53 genotypes were injected into the flanks of Scid mice, and average tumor volume was monitored for 16 d. The number of tumors analyzed is indicated. Error bars show the SD. Photograph shows a representative example of tumors of each genotype at day 16. (B) A selective pressure exists for cells lacking p5325,26 expression during E1A-Ras tumor growth in vivo. (Left) Representative images showing that p5325,26 is expressed in greater than 96% of E1A-Ras MEFs before injection into mice, with DAPI as a nuclear stain. (Right) Representative example of p53 immunofluorescence staining of E1A-Ras p5325,26 tumors. DAPI stain shows that the observed field is uniformly filled with tumor cells. (C) TUNEL staining of histological sections from tumors. (Left) Representative example showing TUNEL+ cells staining brown, with hematoxylin as a counterstain. (Right) Quantification of TUNEL staining. The number of TUNEL+ cells in three 40× fields for each of three to five tumors of each genotype was averaged and graphed ±SEM. *P < 0.03 (Student's t test). (D) p5325,26 does not affect proliferation in vivo. E1A-Ras MEF tumors expressing no p53, p53wt, or p5325,26 were stained for Ki67, with DAPI as a nuclear stain. Shown are representative pictures from multiple experiments. (E) p5325,26 does not inhibit proliferation in vitro. E1A-Ras MEFs expressing no p53, p53wt, or p5325,26 were pulsed for 4 h with BrdU and immunostained for p53 and BrdU. Graph shows the average BrdU-labeling index in three independent experiments, ±SD. Efficient Cre-mediated recombination of the LSL-25,26 allele was confirmed by immunofluorescence staining for p53, with over 94% of the cells expressing p5325,26. For C and D, due to the outgrowth of p53-deficient cells in the p5325,26 tumors, we costained tumors for p53 and either TUNEL or Ki67 and analyzed only regions with homogenous p5325,26 expression.
Fig. 3.
Fig. 3.
Expression of p5325,26 suppresses medulloblastoma in Ptch+/− mice. (A) p5325,26 is efficiently expressed in granule neuron precursor cells. (Left) Sections of Ptch+/−; p53LSL-25,26/LSL-25,26; Math1-Cre P9 cerebella were stained for p53 (Top) and DAPI (Middle). Merged image (Bottom) reveals that only a small percentage of cells are p53 deficient (arrows). (Right) Quantification of the percentage of p53+ cells in the external granular layer (bracket) of the cerebellum is shown. Error bars represent ±SD. (B) Kaplan–Meier analysis showing medulloblastoma incidence for Ptch+/− (p53wt; black), Ptch+/−; p53LSL-25,26/LSL-25,26 (p53null; green), Ptch+/−; p53LSL-wt/LSL-wt (p53null; brown), Ptch+/−; p53LSL-25,26/LSL-25,26; Math1-Cre (p5325,26; red), Ptch+/−; p53LSL-wt/LSL-wt; Math1-Cre (p53wt; pink), and p53LSL-25,26/LSL-25,26 (p53null; blue) mice. (C) Tumors are mainly composed of p53null cells. (Top) Representative H&E-stained sections of advanced tumors from Ptch+/−; p53LSL-25,26/LSL-25,26 (p53null) and Ptch+/−; p53LSL-25,26/LSL-25,26; Math1-Cre (p5325,26) mice and an intermediate tumor (T; outlined region) from a Ptch+/−; p53LSL-25,26/LSL-25,26; Math1-Cre mouse. Sections from corresponding samples were stained for p53 (Middle) and counterstained with DAPI (Bottom). Graph shows the percentage of p53 cells relative to DAPI-stained cells in tumors. Three to four samples per genotype were examined and error bars represent ±SD.
Fig. 4.
Fig. 4.
p5325,26 displays tumor suppressor activity in Eμ-Myc–driven B-cell lymphomas. (A) Schematic of the Eμ-Myc study design. Eμ-Myc mice were crossed to Rosa26-CreER; p53LSL-25,26/+ and Rosa26-CreER; p53LSL-25,26,53,54/+ mice. The resulting Eμ-Myc; Rosa26-CreER; p53LSL-25,26/+ and Eμ-Myc; Rosa26-CreER; p53LS-25,26,53,54/+ mice developed aggressive lymphomas with short latency (tumors in yellow), and the p53 locus underwent LOH, resulting in Eμ-Myc; Rosa26-CreER; p53LSL-25,26/LSL-25,26 and Eμ-Myc; Rosa26-CreER; p53LSL-25,26,53,54/LSL-25,26,53,54 tumors. Lymphoma cells were cultured and treated with 4-OHT to activate Cre and induce recombination of the LSL element and expression of the mutant p53 proteins (p5325,26 in red and p5325,26,53,54 in blue). Tumor cells were retroorbitally injected into syngeneic recipient mice and lymphoma growth was monitored. (B) Time course of recombination after 4-OHT treatment. Eμ-Myc; Rosa26-CreER; p53LSL-25,26/LSL-25,26 lymphoma cells were treated with 1 μM 4-OHT and harvested at different time points for Southern blot analysis using a probe that can differentiate the recombined (Upper band) and nonrecombined (Lower band) LSL-p53 allele (Fig. 1A). The first lane displays DNA from untreated lymphoma cells. (C) Representative Southern blot analysis of DNA from lymphomas that developed in recipient mice. Southern blotting was performed to check the ratio of the recombined and nonrecombined alleles. The first two lanes show untreated cells and 4-OHT–treated cells used for injection. (D) Representative Western blot analysis on p5325,26 expression in the reconstituted lymphomas. The first two lanes show untreated cells and 4-OHT–treated cells used for injection. Hsp60 serves as a loading control. (E) Representative p53 immunohistochemistry (IHC) in the reconstituted lymphomas. The tumor in the upper left corner was reconstituted from untreated Eμ-Myc;Rosa26-CreER;p53LSL-25,26/LSL-25,26 lymphoma cells and tumors 1–3 were from 4-OHT-treated cells and correspond to the same tumors in the Southern blot in (C) and Western blot in (D).
Fig. 5.
Fig. 5.
Suppression of B-cell lymphoma growth by p53 requires transcriptional activation. (A) Time course of recombination after 4-OHT treatment. Eμ-Myc;Rosa26-CreER;p53LSL-25,26,53,54/LSL-25,26,53,54 lymphoma cells were treated with 4-OHT and harvested at different time points for Southern blot analysis, as in Fig. 4. (B) Representative Southern blot analysis of DNA from lymphomas that developed in recipient mice to check the ratio of the recombined and nonrecombined alleles. The first two lanes show untreated cells and 4-OHT-treated cells used for injection. (C) Representative Western blot analysis on p5325,26,53,54 expression in the reconstituted lymphomas. The first two lanes show untreated cells and 4-OHT-treated cells used for injection. Hsp60 serves as a loading control. (D) Representative p53 IHC in the reconstituted lymphomas. The tumor in the Upper Left corner was reconstituted from untreated Eμ-Myc; Rosa26-CreER; p53LSL-25,26,53,54/LSL-25,26,53,54 lymphoma cells and tumors 1–3 were from 4-OHT–treated cells and correspond to the same tumors in the Southern blot in B and Western blot in C.

References

    1. Vousden KH, Prives C. Blinded by the light: The growing complexity of p53. Cell. 2009;137:413–431. - PubMed
    1. Kenzelmann Broz D, Attardi LD. In vivo analysis of p53 tumor suppressor function using genetically engineered mouse models. Carcinogenesis. 2010;31:1311–1318. - PMC - PubMed
    1. Levine AJ, Oren M. The first 30 years of p53: Growing ever more complex. Nat Rev Cancer. 2009;9:749–758. - PMC - PubMed
    1. Brady CA, Attardi LD. p53 at a glance. J Cell Sci. 2010;123:2527–2532. - PMC - PubMed
    1. Green DR, Kroemer G. Cytoplasmic functions of the tumour suppressor p53. Nature. 2009;458:1127–1130. - PMC - PubMed

Publication types

LinkOut - more resources