. 2011 Oct 18;108(42):17556-61.
doi: 10.1073/pnas.1103475108. Epub 2011 Oct 3.

Multimodal neuroimaging dissociates hemodynamic and electrophysiological correlates of error processing

Affiliations

Multimodal neuroimaging dissociates hemodynamic and electrophysiological correlates of error processing

Yigal Agam et al. Proc Natl Acad Sci U S A. .

Abstract

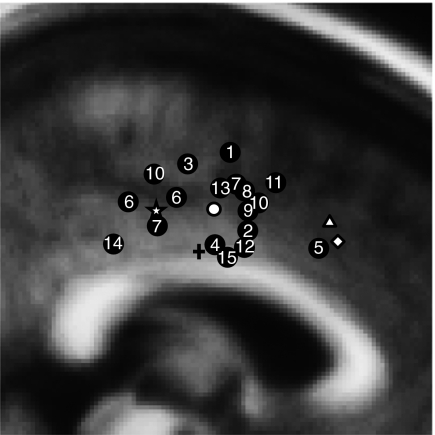
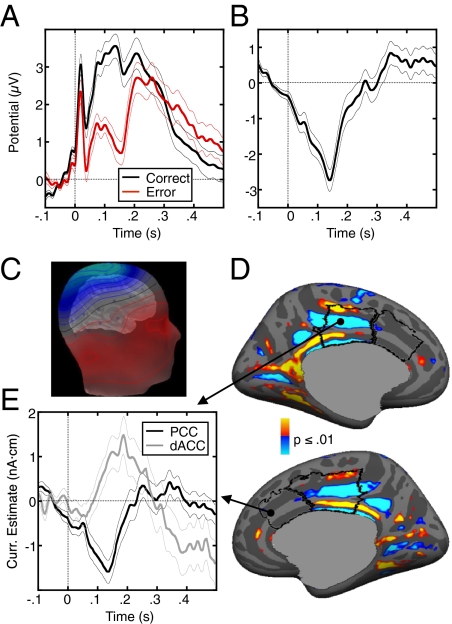
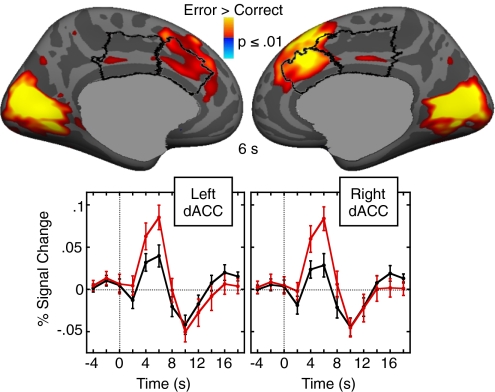
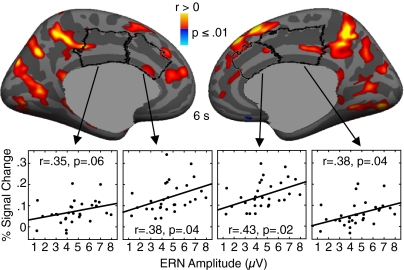
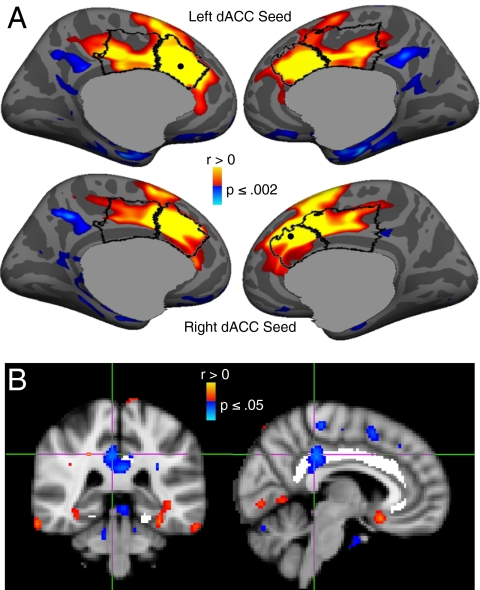
Recognizing errors and adjusting responses are fundamental to adaptive behavior. The error-related negativity (ERN) and error-related functional MRI (fMRI) activation of the dorsal anterior cingulate cortex (dACC) index these processes and are thought to reflect the same neural mechanism. In the present study, we evaluated this hypothesis. Although errors elicited robust dACC activation using fMRI, combined electroencephalography and magnetoencephalography data localized the ERN to the posterior cingulate cortex (PCC). ERN amplitude correlated with fMRI activation in both the PCC and dACC, and these two regions showed coordinated activity based on functional connectivity MRI. Finally, increased microstructural integrity of the posterior cingulum bundle, as measured by diffusion tensor imaging, predicted faster error correction. These findings suggest that the PCC generates the ERN and communicates with the dACC to subserve error processing. They challenge current models that view fMRI activation of the dACC as the hemodynamic reflection of the ERN.


Conflict of interest statement

The authors declare no conflict of interest.

Figures

Fig. 1.
Fig. 1.
A schematic summary of ERN source localizations and error-related fMRI activation displayed on a sagittal slice of the MNI305 brain at x = 3 mm. The numbered circles denote one or more source locations from the 15 studies (Table S1) that either provided coordinates or from which coordinates could be estimated based on anatomical landmarks. The white circle denotes the mean y and z coordinates of the ERN source studies. The triangle indicates the mean y and z coordinates of error-related fMRI activation based on a metaanalysis of 13 fMRI studies (4). The diamond indicates the peak location of error-related fMRI activation from the current study, and the star denotes the peak location of the ERN source estimate of the current study. The plus sign indicates the y coordinate (y = −4) of the dACC-PCC boundary, as defined by Desikan et al. (54).
Fig. 2.
Fig. 2.
ERN. (A) Grand average waveforms for correct (black) and error (red) trials, time-locked to the onset of the saccade. (B) Difference waveform, obtained by subtracting the correct waveform from the error waveform. (C) Scalp distribution of the grand average EEG potentials at the time of the peak in the difference waveform displayed on the template head. Blue and red indicate negative and positive values, respectively. (D) Combined MEG/EEG source estimate of the ERN displayed on the inflated medial cortical surfaces. The statistical maps show vertices where the current estimate was significantly different from zero. The dACC and dorsal PCC are outlined in black. Positive (red) and negative (blue) values indicate currents flowing out and into the cortex, respectively. (E) Time course of the current estimate at the vertices with maximum significance (black circles) in the PCC (black line) and dACC (gray line) at the time of the ERN peak. In A, B, and E, the thin lines on either side of the waveforms represent the SEM for each time sample.
Fig. 3.
Fig. 3.
Error-related fMRI activation at 6 s. Statistical maps are displayed on the inflated medial cortical surfaces. The dACC and dorsal PCC are outlined in black. Warm colors indicate stronger activation on error trials than on correct trials. The gray masks cover subcortical regions in which activity is displaced in a surface rendering. The graphs show the time course of the hemodynamic response in the left and right dACC for error (red) and correct (black) trials averaged across all vertices within the dACC ROIs. Error bars represent the SEM for each time point.
Fig. 4.
Fig. 4.
Relations between error-related fMRI activation and ERN amplitude. Statistical maps showing regression of error-related fMRI activation on ERN amplitude, adjusted for age, are displayed on the inflated medial cortical surfaces. The dACC and dorsal PCC are outlined in black. Warm and cool colors indicate positive and negative correlations, respectively. Scatter plots show fMRI activation in the dACC and dorsal PCC ROIs against ERN amplitude.
Fig. 5.
Fig. 5.
(A) Functional connectivity of the dACC. The statistical maps are projected onto the cortical surface of the template brain. The dACC and dorsal PCC are outlined in black, and the centers of the seed regions are shown as black dots. Activation in both the left (Upper) and right (Lower) dACC seeds correlated with activation in the dorsal PCC. Warm and cool colors indicate positive and negative correlations, respectively. (B) Relation between white matter microstructural integrity as measured by FA in the cingulum bundle and the latency of error self-correction. Images show the statistical map of the correlation. Coronal and sagittal views of the voxel of maximal significance. The cingulum bundle is highlighted in white.

References

    1. Taylor SF, Stern ER, Gehring WJ. Neural systems for error monitoring: Recent findings and theoretical perspectives. Neuroscientist. 2007;13:160–172. - PubMed
    1. Keil J, Weisz N, Paul-Jordanov I, Wienbruch C. Localization of the magnetic equivalent of the ERN and induced oscillatory brain activity. Neuroimage. 2010;51:404–411. - PubMed
    1. Holroyd CB, Coles MG. The neural basis of human error processing: Reinforcement learning, dopamine, and the error-related negativity. Psychol Rev. 2002;109:679–709. - PubMed
    1. Ridderinkhof KR, Ullsperger M, Crone EA, Nieuwenhuis S. The role of the medial frontal cortex in cognitive control. Science. 2004;306:443–447. - PubMed
    1. Gehring WJ, Goss B, Coles MG, Meyer DE, Donchin E. A neural system for error detection and compensation. Psychol Sci. 1993;4:385–390.

Publication types

LinkOut - more resources